Tool/software:
Hi TI experts,
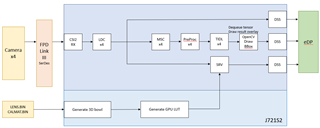
We have developed a custom vision application that performs object detection and surround view simultaneously on TDA4VE in Linux + RTOS mode. (using SDK r10.1)
However, the system occasionally freezes under heavy load.
The application may run normally for several hours before freezing.
Graph:
GRAPH: app_iavm_graph (#nodes =   8, #executions = 135698)
 NODE:       CAPTURE1:             capture_node: avg =  32845 usecs, min/max =  12580 /  62151 usecs, #executions =     135698
 NODE:      VPAC_LDC1:                 ldc_node: avg =  14352 usecs, min/max =  14261 /  14774 usecs, #executions =     135698
 NODE:          MPU-0:          OpenGL_SRV_Node: avg =  11439 usecs, min/max =  10431 /  43922 usecs, #executions =     135698
 NODE:       DISPLAY1:            Display_node1: avg =   8769 usecs, min/max =     63 /  17056 usecs, #executions =     135698
 NODE:      VPAC_MSC1:              scaler_node: avg =  21950 usecs, min/max =  21755 /  22701 usecs, #executions =     135698
 NODE:       DISPLAY2:            Display_node2: avg =  15096 usecs, min/max =     72 /  16745 usecs, #executions =     135698
 NODE:          DSP-1:              PreProcNode: avg =   7129 usecs, min/max =   6491 /   7770 usecs, #executions =     135698
 NODE:       DSP_C7-1:                tidl_node: avg =  23034 usecs, min/max =  20931 /  23742 usecs, #executions =     135698

GRAPH: app_iavm_graph_gpu_lut (#nodes =   2, #executions =      1)
 NODE:          DSP-1:                 node_202: avg =    351 usecs, min/max =    351 /    351 usecs, #executions =          1
 NODE:          DSP-1:                 node_203: avg =  10805 usecs, min/max =  10805 /  10805 usecs, #executions =          1

GRAPH: app_iavm_graph_disp_ovl (#nodes =   1, #executions = 135694)
 NODE:       DISPLAY2:            Display_node2: avg =  14212 usecs, min/max =     70 /  36725 usecs, #executions =     135694

 PERF:           FILEIO: avg =      0 usecs, min/max = 4294967295 /      0 usecs, #executions =          0
 PERF:            TOTAL: avg =  33330 usecs, min/max =  31842 /  34893 usecs, #executions =       7325

 PERF:            TOTAL:   30. 0 FPS
Resource load:
Summary of CPU load,
====================

CPU: mpu1_0: TOTAL LOAD =  34. 5 % ( HWI =   1. 5 %, SWI =   0.26 % )
CPU: mcu2_0: TOTAL LOAD =  14. 0 % ( HWI =   0. 0 %, SWI =   0. 0 % )
CPU: mcu2_1: TOTAL LOAD =   1. 0 % ( HWI =   0. 0 %, SWI =   0. 0 % )
CPU:  c7x_1: TOTAL LOAD =  70. 0 % ( HWI =   0. 0 %, SWI =   0. 0 % )
CPU:  c7x_2: TOTAL LOAD =  22. 0 % ( HWI =   0. 0 %, SWI =   0. 0 % )


HWA performance statistics,
===========================

HWA:   LDC : LOAD =  42.58 % ( 294 MP/s )
HWA:   MSC0: LOAD =  65.25 % ( 294 MP/s )
HWA:   GPU : LOAD =  33.27 % ( 62 MP/s )


DDR performance statistics,
===========================

DDR: READ  BW: AVG =   4646 MB/s, PEAK =  25865 MB/s
DDR: WRITE BW: AVG =   2640 MB/s, PEAK =  13105 MB/s
DDR: TOTAL BW: AVG =   7286 MB/s, PEAK =  38970 MB/s


Detailed CPU performance/memory statistics,
===========================================

  4565.788684 s: DDR_SHARED_MEM: Alloc's: 152 alloc's of 309991564 bytes
  4565.788695 s: DDR_SHARED_MEM: Free's : 1 free's  of 36 bytes
  4565.788702 s: DDR_SHARED_MEM: Open's : 151 allocs  of 309991528 bytes

CPU: mcu2_0: TASK:      FREERTOS_TA:   0. 0 %
CPU: mcu2_0: TASK:           IPC_RX:   0.43 %
CPU: mcu2_0: TASK:       REMOTE_SRV:   0. 0 %
CPU: mcu2_0: TASK:        LOAD_TEST:   0. 0 %
CPU: mcu2_0: TASK:       TIVX_CPU_0:   0. 0 %
CPU: mcu2_0: TASK:        TIVX_V1NF:   0. 0 %
CPU: mcu2_0: TASK:       TIVX_V1LDC:   3.84 %
CPU: mcu2_0: TASK:      TIVX_V1MSC1:   4.99 %
CPU: mcu2_0: TASK:      TIVX_V1MSC2:   0. 0 %
CPU: mcu2_0: TASK:      TIVX_V1VISS:   0. 0 %
CPU: mcu2_0: TASK:       TIVX_CAPT1:   1.92 %
CPU: mcu2_0: TASK:       TIVX_CAPT2:   0. 0 %
CPU: mcu2_0: TASK:       TIVX_CAPT3:   0. 0 %
CPU: mcu2_0: TASK:       TIVX_CAPT4:   0. 0 %
CPU: mcu2_0: TASK:       TIVX_CAPT5:   0. 0 %
CPU: mcu2_0: TASK:       TIVX_CAPT6:   0. 0 %
CPU: mcu2_0: TASK:       TIVX_CAPT7:   0. 0 %
CPU: mcu2_0: TASK:       TIVX_CAPT8:   0. 0 %
CPU: mcu2_0: TASK:       TIVX_DISP1:   0.62 %
CPU: mcu2_0: TASK:       TIVX_DISP2:   2.13 %
CPU: mcu2_0: TASK:       TIVX_CSITX:   0. 0 %
CPU: mcu2_0: TASK:      TIVX_CSITX2:   0. 0 %
CPU: mcu2_0: TASK:      TIVX_DPM2M1:   0. 0 %
CPU: mcu2_0: TASK:      TIVX_DPM2M2:   0. 0 %
CPU: mcu2_0: TASK:      TIVX_DPM2M3:   0. 0 %
CPU: mcu2_0: TASK:      TIVX_DPM2M4:   0. 0 %
CPU: mcu2_0: TASK:      IPC_TEST_RX:   0. 0 %
CPU: mcu2_0: TASK:      IPC_TEST_TX:   0. 0 %
CPU: mcu2_0: TASK:      IPC_TEST_TX:   0. 0 %
CPU: mcu2_0: TASK:      IPC_TEST_TX:   0. 0 %
CPU: mcu2_0: TASK:      IPC_TEST_TX:   0. 0 %

CPU: mcu2_0: HEAP:    DDR_LOCAL_MEM: size =   14680064 B, free =   14591744 B ( 99 % unused)
CPU: mcu2_0: HEAP:           L3_MEM: size =     524288 B, free =     524032 B ( 99 % unused)
CPU: mcu2_0: HEAP:  DDR_CACHE_WT_ME: size =    2097152 B, free =    2096896 B ( 99 % unused)

CPU: mcu2_1: TASK:      FREERTOS_TA:   0. 0 %
CPU: mcu2_1: TASK:           IPC_RX:   0. 0 %
CPU: mcu2_1: TASK:       REMOTE_SRV:   0. 0 %
CPU: mcu2_1: TASK:        LOAD_TEST:   0. 0 %
CPU: mcu2_1: TASK:       TIVX_CPU_1:   0. 0 %
CPU: mcu2_1: TASK:         TIVX_SDE:   0. 0 %
CPU: mcu2_1: TASK:         TIVX_DOF:   0. 0 %
CPU: mcu2_1: TASK:      IPC_TEST_RX:   0. 0 %
CPU: mcu2_1: TASK:      IPC_TEST_TX:   0. 0 %
CPU: mcu2_1: TASK:      IPC_TEST_TX:   0. 0 %
CPU: mcu2_1: TASK:      IPC_TEST_TX:   0. 0 %
CPU: mcu2_1: TASK:      IPC_TEST_TX:   0. 0 %

CPU: mcu2_1: HEAP:    DDR_LOCAL_MEM: size =   16777216 B, free =   16773120 B ( 99 % unused)
CPU: mcu2_1: HEAP:           L3_MEM: size =     524288 B, free =     524288 B (100 % unused)

CPU:  c7x_1: TASK:      FREERTOS_TA:   0. 0 %
CPU:  c7x_1: TASK:           IPC_RX:   0. 5 %
CPU:  c7x_1: TASK:       REMOTE_SRV:   0. 0 %
CPU:  c7x_1: TASK:        LOAD_TEST:   0. 0 %
CPU:  c7x_1: TASK:      TIVX_C71_P1:  69.68 %
CPU:  c7x_1: TASK:      TIVX_C71_P2:   0. 0 %
CPU:  c7x_1: TASK:      TIVX_C71_P3:   0. 0 %
CPU:  c7x_1: TASK:      TIVX_C71_P4:   0. 0 %
CPU:  c7x_1: TASK:      TIVX_C71_P5:   0. 0 %
CPU:  c7x_1: TASK:      TIVX_C71_P6:   0. 0 %
CPU:  c7x_1: TASK:      TIVX_C71_P7:   0. 0 %
CPU:  c7x_1: TASK:      TIVX_C71_P8:   0. 0 %
CPU:  c7x_1: TASK:      IPC_TEST_RX:   0. 0 %
CPU:  c7x_1: TASK:      IPC_TEST_TX:   0. 0 %
CPU:  c7x_1: TASK:      IPC_TEST_TX:   0. 0 %
CPU:  c7x_1: TASK:      IPC_TEST_TX:   0. 0 %
CPU:  c7x_1: TASK:      IPC_TEST_TX:   0. 0 %

CPU:  c7x_1: HEAP:    DDR_LOCAL_MEM: size =  268435456 B, free =  215982080 B ( 80 % unused)
CPU:  c7x_1: HEAP:           L3_MEM: size =    3964928 B, free =          0 B (  0 % unused)
CPU:  c7x_1: HEAP:           L2_MEM: size =     458752 B, free =          0 B (  0 % unused)
CPU:  c7x_1: HEAP:           L1_MEM: size =      16384 B, free =          0 B (  0 % unused)
CPU:  c7x_1: HEAP:  DDR_SCRATCH_MEM: size =  385875968 B, free =  383435737 B ( 99 % unused)

CPU:  c7x_2: TASK:      FREERTOS_TA:   0. 0 %
CPU:  c7x_2: TASK:           IPC_RX:   0. 5 %
CPU:  c7x_2: TASK:       REMOTE_SRV:   0. 0 %
CPU:  c7x_2: TASK:        LOAD_TEST:   0. 0 %
CPU:  c7x_2: TASK:         TIVX_CPU:  21.23 %
CPU:  c7x_2: TASK:      IPC_TEST_RX:   0. 0 %
CPU:  c7x_2: TASK:      IPC_TEST_TX:   0. 0 %
CPU:  c7x_2: TASK:      IPC_TEST_TX:   0. 0 %
CPU:  c7x_2: TASK:      IPC_TEST_TX:   0. 0 %
CPU:  c7x_2: TASK:      IPC_TEST_TX:   0. 0 %

CPU:  c7x_2: HEAP:    DDR_LOCAL_MEM: size =   16777216 B, free =   16767488 B ( 99 % unused)
CPU:  c7x_2: HEAP:           L2_MEM: size =     458752 B, free =     458752 B (100 % unused)
CPU:  c7x_2: HEAP:           L1_MEM: size =      16384 B, free =      16384 B (100 % unused)
CPU:  c7x_2: HEAP:  DDR_SCRATCH_MEM: size =   67108864 B, free =   67108864 B (100 % unused)
Once a freeze occurs, the UART disconnects and becomes unresponsive, JTAG cannot connect, and the power LEDs for the main and mcu domain (LD5 and LD6) turn off.
There are no messages indicating segmentation faults, kernel crashes, or application errors/warnings on the console before the system freezes, except for the following:
 p: Print performance statistics

 0-3: Camera switch

 5: Camera auto switch

 q: 2D View

 w: 3D View

 x: Exit

 Enter Choice:

[21542.579784] audit: type=1334 audit(1744934406.656:29): prog-id=24 op=LOAD
[21542.694036] audit: type=1334 audit(1744934406.768:30): prog-id=24 op=UNLOAD
[26852.389441] tps6594 0-0048: Error IRQ trap reach ilim, overcurrent for BUCK1
Could you please guide us on how to further debug this issue?
Thanks
Regards,
Christopher