This thread has been locked.

If you have a related question, please click the "Ask a related question" button in the top right corner. The newly created question will be automatically linked to this question.

AM620-Q1: How to enable eth log? How to check the eth status?

Part Number: AM620-Q1
Other Parts Discussed in Thread: AM620

Tool/software:

Hi, Dear Expert

      After testing with iperf3 for a period of time, there is a possibility of disconnection. After disconnecting, I tried using the ping command to test if I could connect to the host, but found that I couldn't ping the host. I tried to restart the phy device, but the ping command still failed. I checked the kernel logs and did not find any messages related to eth (Mac). I want to know how to check the status of MAC and how to open MAC related logs?

Thanks,

Xiulin Liu

  • Hi Xiulin,

    What Linux SDK are you using?

    Just confirm, are you testing on a custom built AM62x board?

    Can you share the entire console log before and after the "disconnection", showing the ping failure?

    Can you share the results of "ethtool <interface name>"?

    -Daolin

  • Hi Daolin Qiu,

         1. Current SDK version is Processor SDK 10.00.07.04.

         2. Use our own board
         3. The device has been restarted, and these logs can only be viewed during the next time.
         4. I want to know how to locate if the MAC is working properly the next time we reproduce this phenomenon, as ping still fails after restarting the PHY.
             After restarting the device, it works normally.

    Thanks,

    Xiulin Liu

  • Hi Daolin Qiu

    ethtool -i eth0 msg:

    root@fvt-5g-tbox:~# ethtool -i eth0
    driver: am65-cpsw-nuss
    version: 6.6.32-ti
    firmware-version:
    expansion-rom-version:
    bus-info: 8000000.ethernet
    supports-statistics: yes
    supports-test: no
    supports-eeprom-access: no
    supports-register-dump: yes
    supports-priv-flags: yes

    Thanks,

  • root@fvt-5g-tbox:~# ethtool eth0
    Settings for eth0:
    Supported ports: [ MII ]
    Supported link modes: 1000baseT/Full
    Supported pause frame use: Symmetric
    Supports auto-negotiation: Yes
    Supported FEC modes: Not reported
    Advertised link modes: 1000baseT/Full
    Advertised pause frame use: Symmetric
    Advertised auto-negotiation: Yes
    Advertised FEC modes: Not reported
    Link partner advertised link modes: 1000baseT/Full
    Link partner advertised pause frame use: No
    Link partner advertised auto-negotiation: No
    Link partner advertised FEC modes: Not reported
    Speed: 1000Mb/s
    Duplex: Full
    Auto-negotiation: on
    Port: MII
    PHYAD: 0
    Transceiver: internal
    Supports Wake-on: d
    Wake-on: d
    Current message level: 0x000020f7 (8439)
    drv probe link ifdown ifup rx_err tx_err hw
    Link detected: yes

  • Hi ,

         When this problem occurred, I tried using the tcpdump tool to capture packets. The PC side was able to receive and reply to ARP packets, while the device side only sent ARP packets and did not receive them. Is it caused by the timing mismatch between the PHY and MAC? Is there any way to modify the timing received by the MAC?

    Thanks,

    Xiulin Liu

  • Hi Xiulin,

    The PC side was able to receive and reply to ARP packets, while the device side only sent ARP packets and did not receive them. Is it caused by the timing mismatch between the PHY and MAC?

    Thanks for sharing the previous ethtool output. To double check if the packets on the device side is dropping any received packets you should check the hardware MAC statistics with "ethtool -S eth0" and look for if there are any rx crc errors or drop counters that are incrementing. If there are rx crc errors and you are using RGMII, you need to ensure there is a timing offset between the RGMII RX clock and RGMII RX data lines. Please see section "6 Ethernet PHY Analysis" in the following app note for more details: https://www.ti.com/lit/an/spradj8/spradj8.pdf 

    -Daolin

  • Hi  ,

        1. How to solve CRC error? Because this issue only appeared after one day of operation of iperf3 at a high temperature of 85 degrees Celsius.

        2.  When I tried not to enable the PHY chip rtl9010 register 0xd04a bit2 (RGMIIRXC_timing, add 2ns delay for rxc latching RXD), the phenomenon was the same as this, tcpdump could only capture the sent packets and could not capture the received ones. Using the ethtool - S eth0 command to check, it was found that the counts of rx_crc_ errors and rx_good_frames did not increase, while the count of iet_rx_smd_err increased.

    NIC statistics:
    p0_rx_good_frames: 335062
    p0_rx_broadcast_frames: 88
    p0_rx_multicast_frames: 5687
    p0_rx_crc_errors: 0
    p0_rx_oversized_frames: 0
    p0_rx_undersized_frames: 0
    p0_ale_drop: 0
    p0_ale_overrun_drop: 0
    p0_rx_octets: 27358741
    p0_tx_good_frames: 319491
    p0_tx_broadcast_frames: 5
    p0_tx_multicast_frames: 0
    p0_tx_octets: 145851474
    p0_tx_64B_frames: 134
    p0_tx_65_to_127B_frames: 415049
    p0_tx_128_to_255B_frames: 50252
    p0_tx_256_to_511B_frames: 91486
    p0_tx_512_to_1023B_frames: 60128
    p0_tx_1024B_frames: 37504
    p0_net_octets: 173210215
    p0_rx_bottom_fifo_drop: 0
    p0_rx_port_mask_drop: 0
    p0_rx_top_fifo_drop: 0
    p0_ale_rate_limit_drop: 0
    p0_ale_vid_ingress_drop: 0
    p0_ale_da_eq_sa_drop: 0
    p0_ale_block_drop: 0
    p0_ale_secure_drop: 0
    p0_ale_auth_drop: 0
    p0_ale_unknown_ucast: 0
    p0_ale_unknown_ucast_bytes: 0
    p0_ale_unknown_mcast: 0
    p0_ale_unknown_mcast_bytes: 0
    p0_ale_unknown_bcast: 0
    p0_ale_unknown_bcast_bytes: 0
    p0_ale_pol_match: 0
    p0_ale_pol_match_red: 0
    p0_ale_pol_match_yellow: 0
    p0_ale_mcast_sa_drop: 0
    p0_ale_dual_vlan_drop: 0
    p0_ale_len_err_drop: 0
    p0_ale_ip_next_hdr_drop: 0
    p0_ale_ipv4_frag_drop: 0
    p0_tx_mem_protect_err: 0
    p0_tx_pri0: 319491
    p0_tx_pri1: 0
    p0_tx_pri2: 0
    p0_tx_pri3: 0
    p0_tx_pri4: 0
    p0_tx_pri5: 0
    p0_tx_pri6: 0
    p0_tx_pri7: 0
    p0_tx_pri0_bcnt: 145851474
    p0_tx_pri1_bcnt: 0
    p0_tx_pri2_bcnt: 0
    p0_tx_pri3_bcnt: 0
    p0_tx_pri4_bcnt: 0
    p0_tx_pri5_bcnt: 0
    p0_tx_pri6_bcnt: 0
    p0_tx_pri7_bcnt: 0
    p0_tx_pri0_drop: 0
    p0_tx_pri1_drop: 0
    p0_tx_pri2_drop: 0
    p0_tx_pri3_drop: 0
    p0_tx_pri4_drop: 0
    p0_tx_pri5_drop: 0
    p0_tx_pri6_drop: 0
    p0_tx_pri7_drop: 0
    p0_tx_pri0_drop_bcnt: 0
    p0_tx_pri1_drop_bcnt: 0
    p0_tx_pri2_drop_bcnt: 0
    p0_tx_pri3_drop_bcnt: 0
    p0_tx_pri4_drop_bcnt: 0
    p0_tx_pri5_drop_bcnt: 0
    p0_tx_pri6_drop_bcnt: 0
    p0_tx_pri7_drop_bcnt: 0
    rx_good_frames: 287
    rx_broadcast_frames: 3
    rx_multicast_frames: 19
    rx_pause_frames: 0
    rx_crc_errors: 0
    rx_align_code_errors: 0
    rx_oversized_frames: 0
    rx_jabber_frames: 0
    rx_undersized_frames: 0
    rx_fragments: 0
    ale_drop: 19
    ale_overrun_drop: 0
    rx_octets: 29238
    tx_good_frames: 3240
    tx_broadcast_frames: 85
    tx_multicast_frames: 2843
    tx_pause_frames: 0
    tx_deferred_frames: 0
    tx_collision_frames: 0
    tx_single_coll_frames: 0
    tx_mult_coll_frames: 0
    tx_excessive_collisions: 0
    tx_late_collisions: 0
    rx_ipg_error: 0
    tx_carrier_sense_errors: 0
    tx_octets: 1632048
    tx_64B_frames: 128
    tx_65_to_127B_frames: 576
    tx_128_to_255B_frames: 8
    tx_256_to_511B_frames: 0
    tx_512_to_1023B_frames: 2815
    tx_1024B_frames: 0
    net_octets: 1661286
    rx_bottom_fifo_drop: 0
    rx_port_mask_drop: 19
    rx_top_fifo_drop: 0
    ale_rate_limit_drop: 0
    ale_vid_ingress_drop: 0
    ale_da_eq_sa_drop: 0
    ale_block_drop: 0
    ale_secure_drop: 0
    ale_auth_drop: 0
    ale_unknown_ucast: 265
    ale_unknown_ucast_bytes: 26422
    ale_unknown_mcast: 19
    ale_unknown_mcast_bytes: 2624
    ale_unknown_bcast: 3
    ale_unknown_bcast_bytes: 192
    ale_pol_match: 0
    ale_pol_match_red: 0
    ale_pol_match_yellow: 0
    ale_mcast_sa_drop: 0
    ale_dual_vlan_drop: 0
    ale_len_err_drop: 0
    ale_ip_next_hdr_drop: 0
    ale_ipv4_frag_drop: 0
    iet_rx_assembly_err: 0
    iet_rx_assembly_ok: 0
    iet_rx_smd_err: 140
    iet_rx_frag: 0
    iet_tx_hold: 0
    iet_tx_frag: 0
    tx_mem_protect_err: 0
    tx_pri0: 3240
    tx_pri1: 0
    tx_pri2: 0
    tx_pri3: 0
    tx_pri4: 0
    tx_pri5: 0
    tx_pri6: 0
    tx_pri7: 0
    tx_pri0_bcnt: 1632048
    tx_pri1_bcnt: 0
    tx_pri2_bcnt: 0
    tx_pri3_bcnt: 0
    tx_pri4_bcnt: 0
    tx_pri5_bcnt: 0
    tx_pri6_bcnt: 0
    tx_pri7_bcnt: 0
    tx_pri0_drop: 0
    tx_pri1_drop: 0
    tx_pri2_drop: 0
    tx_pri3_drop: 0
    tx_pri4_drop: 0
    tx_pri5_drop: 0
    tx_pri6_drop: 0
    tx_pri7_drop: 0
    tx_pri0_drop_bcnt: 0
    tx_pri1_drop_bcnt: 0
    tx_pri2_drop_bcnt: 0
    tx_pri3_drop_bcnt: 0
    tx_pri4_drop_bcnt: 0
    tx_pri5_drop_bcnt: 0
    tx_pri6_drop_bcnt: 0
    tx_pri7_drop_bcnt: 0

    Thanks

  • Hi Xiulin,

    iet_rx_smd_err: 140

    Looking up the details of this statistic in the TRM, it seems like this is related to IET (Interspersed Express Traffic). Are you setting up some sort of IET configuration? 

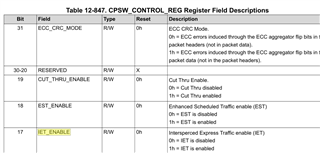
    Additionally, is IET_ENABLE set in your test environment? 

      1. How to solve CRC error? Because this issue only appeared after one day of operation of iperf3 at a high temperature of 85 degrees Celsius.

    Are you seeing the rx_crc_error counter incrementing when this happens? When applying the high temperature, was it applied on your entire custom board or just the AM620 processor? To my knowledge, the AM62x processor should have passed CPSW iperf functional testing up a temperature of 100 degrees Celsius, so perhaps there is a component on your board (maybe your Ethernet PHY?) that might not be functioning properly at 85 degrees C? While I cannot comment on the PHY chip rtl9010 since it's not a TI part, it might be worth checking if you can read any registers from this PHY indicating that packets are being transmitted and received.

    When I tried not to enable the PHY chip rtl9010 register 0xd04a bit2 (RGMIIRXC_timing, add 2ns delay for rxc latching RXD), the phenomenon was the same as this, tcpdump could only capture the sent packets and could not capture the received ones.

    Please note, the goal is to introduce the 2ns delay to create an offset between the clock and data lines (if this wasn't done already) and this is usually the main reason for RX CRC errors.

    -Daolin

  • Hi ,

        1. Are you setting up some sort of IET configuration? 

        --> I didn't set this up, does the platform default enable it? How to open it? How to close it? How to check if it is open?

        2. Next time I reproduce this issue, I will check crc error and PHY recv/send packets.

        3. Please note, the goal is to introduce the 2ns delay to create an offset between the clock and data lines (if this wasn't done already) and this is usually the main reason for RX CRC errors.

        --> If not to enable the PHY chip rtl9010 register 0xd04a bit2, ping cmd is failed, and no crc errors, just have iet_rx_smd_err: 140.

    Thanks.

  • Hi Xiulin,

        2. Next time I reproduce this issue, I will check crc error and PHY recv/send packets.

    Okay, please let me know once you do.

    When applying the high temperature, was it applied on your entire custom board or just the AM620 processor?

    Can you confirm the above question?

    -Daolin

  • Hi ,

          1. The entire board is placed inside the high-temperature chamber.

           2. --> I didn't set this up, does the platform default enable it? How to open it? How to close it? How to check if it is open?

                 Can you answer this question?

    Thanks,

  • Hi Xiulin,

        1. Are you setting up some sort of IET configuration? 

        --> I didn't set this up, does the platform default enable it? How to open it? How to close it? How to check if it is open?

    Additionally, is IET_ENABLE set in your test environment? 

    My initial thought was if you can check if IET_ENABLE is set in your test environment (please don't make any changes, just check what it is currently configured as). As I showed in the screenshot it looks like the IET_ENABLE bit is in the CPSW_CONTROL_REG register at register address 00020004h. You can do "devmem2 0x00020004" to read the contents of the register and check if what is the IET_ENABLE bit configured as.

        1. The entire board is placed inside the high-temperature chamber.
    To my knowledge, the AM62x processor should have passed CPSW iperf functional testing up a temperature of 100 degrees Celsius, so perhaps there is a component on your board (maybe your Ethernet PHY?) that might not be functioning properly at 85 degrees C? While I cannot comment on the PHY chip rtl9010 since it's not a TI part, it might be worth checking if you can read any registers from this PHY indicating that packets are being transmitted and received.

    Is there a possibility that there is another component on the board that is failing at high-temperatures? Like I mentioned before, perhaps checking the PHY registers to ensure the PHY is working properly. Is this related to https://e2e.ti.com/support/processors-group/processors/f/processors-forum/1506023/am620-q1-am620-q1-high-temperature-85-degrees-celsius-eth-iperf-test-eth-driver-crash-issue ?

    -Daolin

  • Hi ,

         After this problem occurred, I tried to read and write the registers of the PHY normally, and also tried to power on and off the PHY chip again, reinitialize it, but the result was still that it could send but not receive. Only by restarting the AM62x can data be sent and received normally.

    Thanks

  • Hi Xiulin, 

    To my knowledge, the AM62x processor should have passed CPSW iperf functional testing up a temperature of 100 degrees Celsius, so perhaps there is a component on your board (maybe your Ethernet PHY?) that might not be functioning properly at 85 degrees C? While I cannot comment on the PHY chip rtl9010 since it's not a TI part, it might be worth checking if you can read any registers from this PHY indicating that packets are being transmitted and received.

    Did you check if the PHY registers show that there are packets being received after the problem occurred?

    -Daolin