This thread has been locked.

If you have a related question, please click the "Ask a related question" button in the top right corner. The newly created question will be automatically linked to this question.

AM62A7: The Display flicker, when running the AI model

Part Number: AM62A7

Tool/software:

Hello TI Experts,

      I'm currently working with AM62A7 and encountering an issue with display flicker when running the AI model. 

Detailed Description:

1. when I run the pipeline for camera display and get data from tiovxisp by appsink, everything is ok

v4l2src device=/dev/video3 io-mode=5 ! \
video/x-bayer, width=2160, height=1784, format=bggr12, framerate=54/1 ! \
queue leaky=2 ! \
tiovxisp sensor-name=SENSOR_OX3C \
dcc-isp-file=/opt/imaging/ox8d/wdr/dcc_viss_wdr.bin \
sink_0::dcc_2a_file=/opt/imaging/ox8d/wdr/dcc_2a_wdr.bin sink_0::device=/dev/v4l-subdev2 format-msb=11 \
sink_0::pool-size=2 src::pool-size=2 ! \
queue leaky=2 ! \
tiovxldc dcc-file=/opt/imaging/ox8d/wdr/dcc_ldc_wdr.bin sensor-name=SENSOR_OX3C \
sink_0::pool-size=2 src::pool-size=2 ! \
video/x-raw, format=NV12, width=1784, height=2160,framerate=54/1 ! queue leaky=2 ! \
tiovxmultiscaler name=split_0 src_0::roi-startx=0 src_0::roi-starty=0 src_0::roi-width=1784 src_0::roi-height=2160 target=0 \
src_1::roi-startx=0 src_1::roi-starty=0 src_1::roi-width=1784 src_1::roi-height=2160 target=1 \
interpolation-method=16385 \
split_0. ! queue ! \
video/x-raw, width=1784, height=2160 ! \
tiscaler roi-startx=284 roi-starty=1310 roi-width=1500 roi-height=850 method=0 ! \
video/x-raw, width=1280, height=720, framerate=54/1 ! mosaic_0. \
split_0. ! queue ! \
video/x-raw, width=640, height=720 ! mosaic_0. \
tiovxmosaic name=mosaic_0 target=0 src::pool-size=4 \
sink_0::startx="<640>" sink_0::starty="<0>" sink_0::widths="<1280>" sink_0::heights="<720>" \
sink_1::startx="<0>" sink_1::starty="<0>" sink_1::widths="<640>" sink_1::heights="<720>" ! \
video/x-raw,format=NV12, width=1920, height=720 ! queue leaky=2 max-size-buffers=1 ! \
videoflip method=rotate-180 ! \
kmssink driver-name=tidss async=false sync=false can-scale=false pq-file=/usr/local/apd/manifest/ECU_CMS/pq_config.json gamma-set=

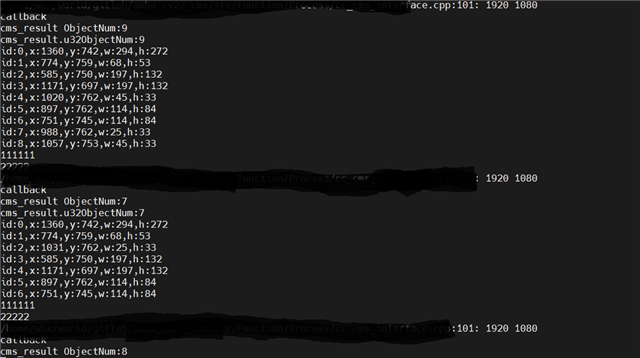
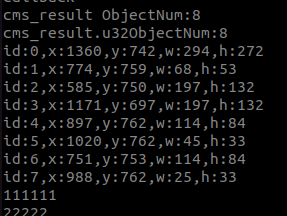
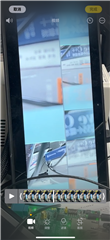
2. Based on the above, when I use the images acquired by appsink for our custom AI model inference, the following situation occurs

/cfs-file/__key/communityserver-discussions-components-files/791/6064.Video.mp4

3. Then I did some tests:

  • Decreasing the input size and frequency of the model, this problem still occurs. 
  • Run some AI models provided by TI model zoo, the flicker disappear.
  • Using udpsink for displaying on PC,display is ok.
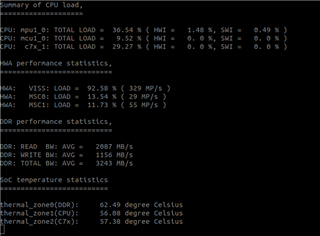
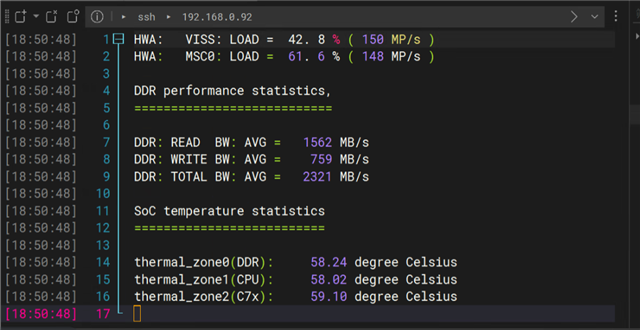
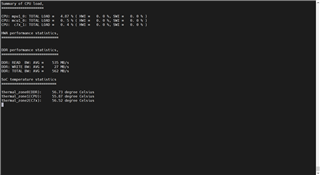
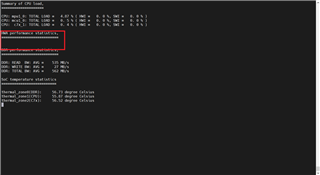
  • Check the CPU usage rate is 70%, NPU is 15%.

Question:
1.Why does running AI models affect kmssink, and is there any connection between them?

2.The problem seems to be related to the specific AI model, can you provide some suggestions to solve the problem?

Best regards,

Jialin

  • Hi Jialin,

    The flickering may be caused by system overload.

    When there is flickering, what's load on MSC0 and MSC1? How about DDR?

    Is there any difference in system load between TI model and your own model?

    I noticed you have tiscaler and videoflip in the pipeline. Is there any specific reason why you use tiscaler instead of tiovxmultiscaler? Do you know you can rotate the image using LDC: https://e2e.ti.com/support/processors-group/processors/f/processors-forum/1418598/faq-tda4vm-vpac-ldc-configuration-for-image-flipping-tda4x-am6xa?

    Regards,

    Jianzhong

  • HI,Jianzhong:

    According to your suggestion, we have made the following attempts:

    1. We used a simpler pipeline:

    v4l2src device=/dev/video3 io-mode=5 ! \
    video/x-bayer, width=2160, height=1784, format=bggr12, framerate=54/1 ! \
    queue leaky=2 ! \
    tiovxisp sensor-name=SENSOR_OX3C \
    dcc-isp-file=/opt/imaging/ox8d/wdr/dcc_viss_wdr.bin \
    sink_0::dcc_2a_file=/opt/imaging/ox8d/wdr/dcc_2a_wdr.bin sink_0::device=/dev/v4l-subdev2 format-msb=11 \
    sink_0::pool-size=2 src::pool-size=2 ! \
    queue leaky=2 ! tiovxmultiscaler ! video/x-raw,format=NV12, width=1920, height=720 ! queue leaky=2 max-size-buffers=1 ! \
    kmssink driver-name=tidss async=false sync=false can-scale=false pq-file=/usr/local/apd/manifest/ECU_CMS/pq_config.json gamma-set=0

    there is also flickering

    2.We used the top and perf_stats to observe system load, no anomalies were found, which is detailed as follows:
    TI model:

    our own model:

    3. We found that as long as we used MSC(tiovxmutiscaler or tiovxmosaic) in our pipeline, there is flickering. But when remove tiovxmutiscaler and tiovxmosaic, or replace tiovxmutiscaler by tiscaler, the flicker disappear.

    4. We used tiscaler because we need to increase the size of the image in some cases, videoflip is not necessary and has no effect on the problem.

    Question:

    1. We found no difference between TI and our own model on the system load. Is there any other load here that we are not observing?

    2. We have to use MSC, so we can only optimize the model. Do you have for advice on model-side optimization?


  • Hi Jialin,

    Based on your following observations, this seems to be related to display:

    • Using udpsink for displaying on PC,display is ok.
    • The simpler pipeline also has the flickering issue

    I noticed some plugin properties are not in the kmssink originally packaged in the SDK, such as pq-file, gamma. Did you modify the kmssink?

    Can you try the original kmssink with default parameters and see if there is flickering?

    Thank you.

    Jianzhong

  • Hi Jianzhong,

    We replaced the original kmssink with default parameters, there is also flickering.

    Regards,

    Jialin

  • Hi Jianzhong,

      Today, we communicated with Adam Hua, and we will  provide the reproduction method for TI experts to locate the problem.
    Reproduction steps:
    0. Environment: 9.2 SDK

    1. Unpack the attachments test.zip to the board. And the unzipped file will be in the following directory, which is used for our own model inferencing.

    2. Give the file executable permissions, and run the program.

    chmod +x ./10_01_tx
    ./10_01_tx

    After that, you can see the log in the terminal. 

    3. Run the GStreamer pipeline in other terminal, and you can the see the flicker.

    A reference pipeline in our own board:

    v4l2src device=/dev/video3 io-mode=5 ! \
    video/x-bayer, width=2160, height=1784, format=bggr12, framerate=54/1 ! \
    queue leaky=2 ! \
    tiovxisp sensor-name=SENSOR_OX3C \
    dcc-isp-file=/opt/imaging/ox8d/wdr/dcc_viss_wdr.bin \
    sink_0::dcc_2a_file=/opt/imaging/ox8d/wdr/dcc_2a_wdr.bin sink_0::device=/dev/v4l-subdev2 format-msb=11 \
    sink_0::pool-size=2 src::pool-size=2 ! \
    queue leaky=2 ! tiovxmultiscaler ! video/x-raw,format=NV12, width=1920, height=720 ! queue leaky=2 max-size-buffers=1 ! \
    kmssink driver-name=tidss async=false sync=false can-scale=false

    The above is a simple reproduction on our development board.

    test.zip8053.test.zip

    Thank you.

    Jialin

  • Hi Jialin,

    I don't have the same sensor. , do you have OX3C to run this test on your side?

    Thanks,

    Jianzhong

  • Hi Jianzhong ,

    I don't have that either. But I will try imx219 to see if I can see the same phenomena .

  • Hi 

    Unable to run your app due to error:

    root@am62axx-evm:/opt/test# ./10_01_tx 
    [2025-05-21 18:54:03.916] ./10_01_tx: error while loading shared libraries: libopencv_core.so.405: cannot open shared object file: No sy

    Please check your opencv version used:

    root@am62axx-evm:/opt/test# opencv_version 
    [2025-05-21 18:54:30.586] 4.9.0
    

    Regards,

    Adam

  • Hi Adam Hua,

        The sdk we are using is 9.2, and Opencv is 4.5, make sure that the SDK version you are using.

        Maybe the name of the executable misled you that it is 10.1

    Thank you,

    Jialin

  • Hi Jialin,

    I am unable to reproduce your issue on evm. There is no display tearing issue.

    My loading:

    log of your app 10_01_tx

    I am running display related app:

    root@am62axx-evm:/opt/edgeai-gst-apps# ./apps_cpp/bin/Release/app_edgeai configs//object_detection.yaml

    And because I do not have the image sensors you are using, I run run_app_viss.sh to create huge loading on viss. 

    However, here are some suspects: image size 2160x1784 @54 should contribute to 208 MP/s for both MSC and VISS, but your loading is much smaller than this. Which means the frame rate of output of MSC is lower than 54Hz. If your display is configured to run at 54Hz, there maybe some synchronization issues. 

    Regards,

    Adam

  • Hi 

    But when remove tiovxmutiscaler and tiovxmosaic, or replace tiovxmutiscaler by tiscaler, the flicker disappear.

    Can you also check the loading of system when using tiscaler?

    Regards,

    Adam

  • Hi 

    Also please check this link:

    https://e2e.ti.com/support/processors-group/processors/f/processors-forum/1410891/am62a7-q1-3840x2160-unable-to-run-vpac-with-viss-and-ldc-at-30-fps

    There are some issues with MSC related plugin. Please try the patches in that link.

    Regards,

    Adam

  • Hi Adam,

     We used another camera module(1920x1280@60fps) for the testing, there is also flickering. And system load seems to be right as well.

    the test pipeline:

    gst-launch-1.0 v4l2src device=/dev/video3 io-mode=5 ! video/x-bayer, width=1920, height=1280, format=bggr12, framerate=60/1 ! queue leaky=2 ! tiovxisp sensor-name=SENSOR_OX3C dcc-isp-file=/opt/imaging/ox03c-60/wdr/dcc_viss_wdr.bin sink_0::dcc_2a_file=/opt/imaging/ox03c-60/wdr/dcc_2a_wdr.bin sink_0::device=/dev/v4l-subdev2 format-msb=11 sink_0::pool-size=2 src::pool-size=2 ! queue leaky=2 ! tiovxmultiscaler ! video/x-raw,format=NV12, width=1920, height=720 ! queue leaky=2 max-size-buffers=1 ! kmssink driver-name=tidss async=false sync=false src-w=1920 src-h=720 can-scale=false

    the system load:

    And we will try the patches in that link as soon as possible, and give the results.

    Thanks,

    Jialin

  • Hi Adam,

     we couldn't compile the code in the patches because of no member error:
     

    the tivx_vpac_msc_input_params_t is defined in 

    /usr/include/processor_sdk/imaging/kernels/include/TI/hwa_vpac_msc.h, and there is no

    member named is_enable_simul_processing

    Could the patches be applied to version 9.2?

  • Hi

    This patch is not for 9.2 but can be a reference. BTW, do you have any way that does not involve x3c or other sensor modules to reproduce this issue? We only have imx219 on our side now.

    Regards,

    Adam

  • Hi Adam,

      We could not reproduce it on the EVM using the IMX219 as well,  it only appears in our own board.

      But running the pipeline and TI model simultaneously, everything works fine, when running with our own model, it doesn't work. And it seems that there are no abnormalities in the system load here. This left us very puzzled.

      We will check the fps to the KMS again. And do you have any other suggestions?

    Thanks,

    Jialin

  • Hi Jialin,

    And do you have any other suggestions

    Not much ideas now. But it will help a lot if you can provide a way to reproduce it on evm without the required sensor.

    Regards,

    Adam

  • Hi Adam,

     We upgraded SDK to 10.1, the flicker seems to disappear. However, there is another issue here.

     When we run the  and simultaneously execute the following pipeline, the pipeline will freeze after 10 seconds.

    gst-launch-1.0 \
    v4l2src device=/dev/video3 io-mode=5 ! \
    video/x-bayer, width=1920, height=1280, format=bggr12, framerate=60/1 ! \
    queue leaky=2 ! \
    tiovxisp sensor-name=SENSOR_OX3C_100 \
    dcc-isp-file=/opt/imaging/ox03c/wdr/dcc_viss_wdr.bin \
    sink_0::dcc_2a_file=/opt/imaging/ox03c/wdr/dcc_2a_wdr.bin sink_0::device=/dev/v4l-subdev2 format-msb=11 \
    sink_0::pool-size=2 src::pool-size=2 ! \
    queue leaky=2 ! \
    tiovxldc dcc-file=/opt/imaging/ox03c/wdr/dcc_ldc_wdr.bin sensor-name=SENSOR_OX3C_100 \
    sink_0::pool-size=2 src::pool-size=2 ! \
    video/x-raw, format=NV12, width=1280, height=1920,framerate=60/1 ! queue leaky=2 ! \
    tiovxmultiscaler name=split_0 src_0::roi-startx=0 src_0::roi-starty=0 src_0::roi-width=1280 src_0::roi-height=1920 target=0 \
    src_1::roi-startx=0 src_1::roi-starty=0 src_1::roi-width=1280 src_1::roi-height=1920 target=1 \
    interpolation-method=16385 \
    split_0. ! queue ! \
    video/x-raw, width=1280, height=1920 ! \
    tiscaler roi-startx=284 roi-starty=1310 roi-width=800 roi-height=400 method=0 ! \
    video/x-raw, width=1280, height=720, framerate=60/1 ! mosaic_0. \
    split_0. ! queue ! \
    video/x-raw, width=640, height=720 ! mosaic_0. \
    tiovxmosaic name=mosaic_0 target=0 src::pool-size=4 \
    sink_0::startx="<640>" sink_0::starty="<0>" sink_0::widths="<1280>" sink_0::heights="<720>" \
    sink_1::startx="<0>" sink_1::starty="<0>" sink_1::widths="<640>" sink_1::heights="<720>" ! \
    video/x-raw,format=NV12, width=1920, height=720 ! queue leaky=2 max-size-buffers=1 ! \
    kmssink driver-name=tidss 

     Under the state, this phenomenon will not occur with 9.2, and the system load of 10.1 is the same as that of 9.2.

     In particular, we found that:

      1. it seemed to be related to LDC. When we removed LDC, this phenomenon no longer occurred.

      2. Running the pipeline alone will not have this problem either.

    Could this be related to shared memory? Can you provide some ways to  to check the usage of shared memory or some advices on this problem. 

  • Hi Jialin,

    Please run like this:

    GST_DEBUG_FILE=/run/trace.log GST_DEBUG_NO_COLOR=1 GST_DEBUG=5 gst-launch-1.0 ...

    This will enable more log and save them to /run/trace.log. Please upload the log if you capture this problem.

    Regards,

    Adam

  • Hi Adam,

    The log is a bit large. The pipeline is blocked after running for approximately 10 seconds. Once it is stocked, we immediately stopped the pipeline operation.

    /cfs-file/__key/communityserver-discussions-components-files/791/4130.trace.log

    we found that vpac was not working

    thanks,

    Jialin

  • Hi Jialin,

    Sorry I can not download from the link. Please upload the log again. 

    we found that vpac was not working

    How do you know vpac is not working?

    Regards,

    Adam

  • Hi Adam,

     Here is the log,5123.trace.log

    Because there is no system load on vpac,msc,and ldc

    Thanks,

    Jialin 

  • Hi Jialin,

    After checking your log carefully, I did not find any errors related. 

    1. it seemed to be related to LDC. When we removed LDC, this phenomenon no longer occurred.

    Can you enable R5F log by running /opt/vision_app_init.sh before you run your app?

    Running the pipeline alone will not have this problem either.

    What do you mean by running this pipeline along? did you start other application and once other application starts,  the phenomenon happens?

    Regards,

    Adam 

  • Hi Adam,

    What do you mean by running this pipeline along? did you start other application and once other application starts,  the phenomenon happens?

    Regards,

    Yes, everything seems to be ok. However when we start our own AI model in other terminal, the  phenomenon happens in 10s.

    Can you enable R5F log by running /opt/vision_app_init.sh before you run your app?

    We tried it, and here is the log.  This error has nothing to do with the problem. Because this error is also output under normal conditions.

    Thanks,

    Jialin

  • Hi jialin

    It seems that your other application do have impact on the gstreamer pipeline. Does this phenomena has something to do with the model? Is ti model also has this problem?

    Regards,

    Adam

  • Hi Adam,

       This phenomena has nothing to do with the model, the AI mode is running  normally.

  • I see, can you provide a reproduce method? We can help better if we can reproduce on our side. We don't have x3c here. so can you use file reading method?

    Regards,

    Adam

  • Hi Adam,

     We could not reproduce it on EVM by a file, because it seems  to be relative to tiovxldc plugin. When we removed it, everything is ok.

     So is there a way to read data from a file and output it to tiovxldc ?

    or are there any other ways to rotate the image by 90 degrees apart from the LDC plugin? We tried using videoflip, but the fps dropped significantly.

    Thanks,

    Jialin

  • Hi Adam, Jianzhong,
      Based on yesterday's meeting discussion, we have made the following two attempts:

    1. Increasing the DDR frequency to 3200MHz, the phenomenon of video stream pipeline freezing still occurs.

    2. Quantify and compile models from both the algorithm supplier and TI model zoo. Using the supplier's algorithm will result in freezing, while using the TI model will not.
      What are the suggested debugging strategies for the next step? In addition, it was mentioned during the meeting that image rotation can be done through DSS. Our requirement is to rotate the image counterclockwise by 90 degrees. Can you provide some technical support or reference materials?

    Regards,

    Yangtian

  • Hi Yangtian,

    Can you do some DDR benchmarking like what you provided in this thread? It would be good to know the DDR load when you run the camera pipeline and AI. What you could do is:

    1. measure DDR when nothing is running
    2. measure DDR when you only run the camera pipeline. The difference with #1 will give you the DDR load of camera pipeline.
    3. measure DDR when you only run the AI model. The difference with #1 will give you the DDR load of AI.
    4. sum of the above is the DDR load.

    I checked internally about the memory error. It looks like some memory corruption. 

    , do you have any comments on using DSS to rotate the image counterclockwise by 90 degrees.

    Regards,

    Jianzhong

  • Hi,

    Unfortunately, DSS has no mechanism to rotate the frames internally and this task has to be undertaken by the userspace application itself.