This thread has been locked.

If you have a related question, please click the "Ask a related question" button in the top right corner. The newly created question will be automatically linked to this question.

TDA4VM: How to Measure TOPS Utilization on TDA4VM for Custom Models Using TFLite and EdgeAI SDK

Part Number: TDA4VM

Tool/software:

Hi TI Team,

We are using the TDA4VM platform with custom deep learning models running through the TFLite runtime with the TIDL delegate, as part of the EdgeAI SDK (from https://github.com/TexasInstruments/edgeai-tidl-tools).

Our goal is to measure the effective TOPS (Tera Operations Per Second) utilized per model or per inference execution, in order to understand hardware utilization and optimize our deployment.

We have already integrated our models using the edgeai-tidl-tools flow and can run inference via TFLite in both Python and C++.

Could you please guide us on the following:

  1. What is the recommended method to estimate or measure TOPS per inference using the EdgeAI SDK or TIDL tools?

  2. Can we access real-time TIDL accelerator utilization or profiling data (e.g., via logs or system APIs)?

Regards

Ashay

  • Hi Ashay,

    The quickest way to get this information is to turn up the debug level.  These instructions are for osrt_python/onnx, but they are similar for osrt_python/tfl.  From edgeai-tidl-tools, cd to examples/osrt_python/ort/.  Then edit vi ../common_utils.py  and change the following line:

    From:

    debug_level = 0

    To:

    debug_level = 4

    Then in the ort/ directory run:

    python3 ./onnxrt_ep.py -c -m cl-ort-resnet18-v1

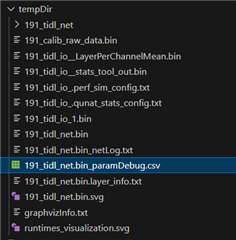
    This is a test model, but you will find information in the output and in edgeai-tidl-tools/model-artifacts/cl-ort-resnet18-v1/artifacts/tempDir/subgraph_0_tidl_net.bin_paramDebug.csv.  

    Next for the ort/ directory add your model to ../model_configs.py and run your model.   You will get the same output for your model.

    Regards,

    Chri

  • Hi Chri,

    thanks for your repsonse. I ran it on the "cl-ort-resnet18-v1" as instructed. I do not get the files with the same naming as you referred. This could be because I am on a different version/tag of edge-ai-tidl. 

    However, I read the highlighted file and this doesn't provide the required information. I however noticed, 191_tidl_net.bin_netLog.txt contains layerwise MACs and total GMACs. I think this is helpful to me, but I want to make sure that my understanding is correct. Could you please confirm if this is the file I should use? 

    Or, in case this is not correct, can you provide an example of how output from the file that you mentioned looks like?

    Thank you!

    Best

    Ashay 

  • Hi Ashay,

    Yes, the file names will vary from version to version, and model names and other configuration parameters.  Additionally, yes, you can use that file; it will provide a good idea of where the cycles are consumed. 

    Regards,

    Chris

  • Hi Chris, thanks for your response.
    Is there something additionally that could reflect the performance in terms of computation for ex: how much memory is being used on accelerator and so on? Your inputs are highly appreciated Slight smile

    Best

    Ashay