This thread has been locked.

If you have a related question, please click the "Ask a related question" button in the top right corner. The newly created question will be automatically linked to this question.

TDA4VEN-Q1: Optimization Summary

Part Number: TDA4VEN-Q1

Tool/software:

Hello engineers,

I have a question regarding the compilation process using edgeai-tidl-tools. I don't understand whether the colors in "Nodes after optimization" indicate correctness or errors.

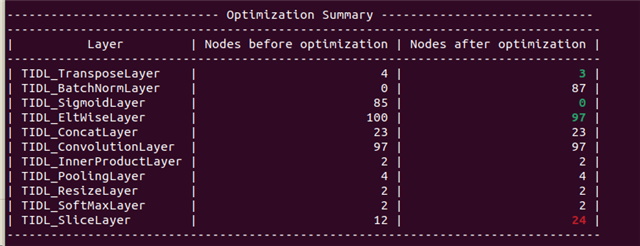
We can see red and green colors in the "Nodes after optimization" graph. Does the red color here represent unsupported operators? However, I checked github.com/.../custom_model_evaluation.md and found that TIDL_SliceLayer is supported.

  • Hi Ylinly,

    The white colors mean "No Change" after optimization.   The Green colors mean reduction in layers and the Red color means addition of layers after optimization.   TIDL will reformat the graph and keep it functionally the same with optimization.  

    The benefits of reduction of layers by optimization is obvious.  The addition of layers are layers like batchnorm or other operations  that optimize the data flow though the network.

    Regards,

    Chris

  • Thank you !