


Part Number: CCSTUDIO
Other Parts Discussed in Thread: AUDIO-AM275-EVM
Tool/software:
Hello Team,
For my development of a C7x core based application to run on AUDIO-AM275-EVM, I'm using CCS 20.2 for debugging. For a suspected heap overflow, I wanted to inspect a few memory read/write operations and I came to know via an earlier thread that Watchpoints can be used. However, when I try the instructions to add hardware breakpoints using Watchpoints, I don't find the option there:
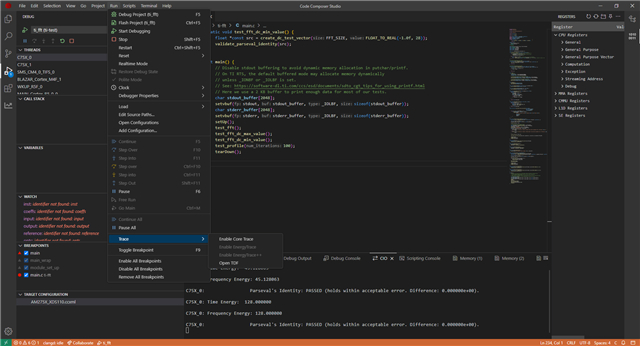
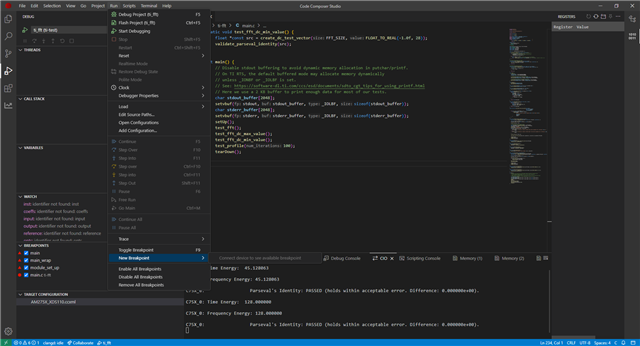
As you can see from the above screenshot, the Run menu doesn't have an item New Breakpoint → Hardware Watchpoint as mentioned in the documentation (shared in the link above) at all in my IDE. However, when I stop the debugger, I can see a new menu item New Breakpoint but since the target is not connected it says Connect device to see available breakpoint as shown below:
I would like to know if this is this a:
- target-specific restriction,
- a bug in CCS,
- a misconfigured setting,
- or a target binary problem
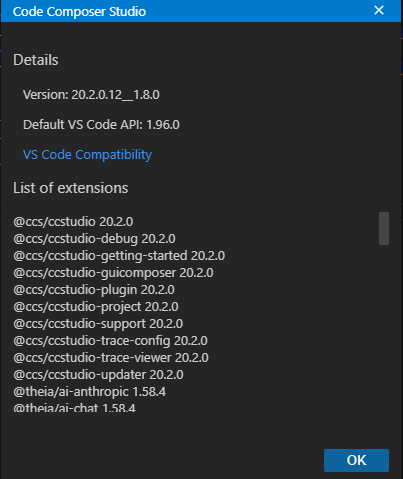
The following is the IDE version details I'm using:
I would really appreciate any help in getting the Watchpoint setting up and running.
Regards,
Sreekanth
