DRA78XEVM: Unexpected stall cycles in tracing

Part Number: DRA78XEVM

Tool/software:

Hi,

on C66, CCS 10, I'm tracing a simple function that do some checks and when these checks are positive invoke a function derived from an address parameter, I see the instruction
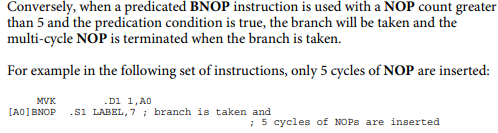
BNOP.S2 B3,4 

Taking 4 cycles (row 9, column Delta cycles) as expected

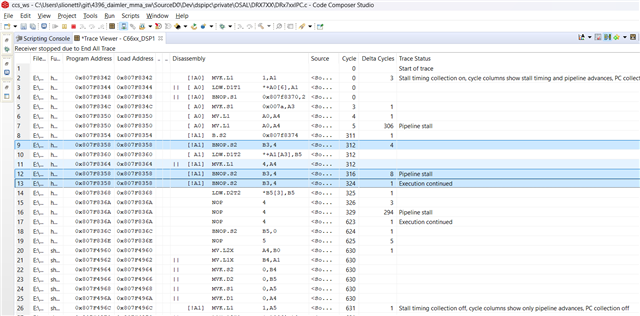
but then the same address is showed again with 8+1 delta cycles.

This is not expected, as reported on sprugh7:

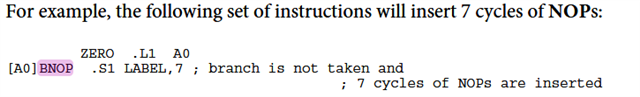
Why are these extra cycles reported? Are just a tool artifact?

The trace option is "Custom Core Trace", with Trigger1 "Start trace" at "Point", Trigger2 "Stop trace" at Point.

Thanks for the attention

  • Salvatore,

    I believe this is a symptom from the Pipeline stall, due to some hazard, "bubbles" or cycles are inserted delaying the entire pipeline including the BNOP, causing it to be processed for extra cycles as it waits its turn. then a second one is called again and can branch already and the BNOP is terminated in only one cycle.. example from same sprugh7:

    Best,

    Josue

  • Thanks, the problem is that if the stall is not accounted on the intended instruction it is hard to understand the situation.

    In this sense, do you know why only for some pipeline stall appears "Execution Continued"?

  • Salvatore,

    I am not 100% sure, (not a C66 architecture expert), but it seems like it is a stall the the processor is able to deal with and this is the signal that it resumes its normal pipelined operation. Other stalls might not be as easily recoverable and should show more details.

    -Josue