Other Parts Discussed in Thread: TDA4VH
Tool/software:
Hi TI.
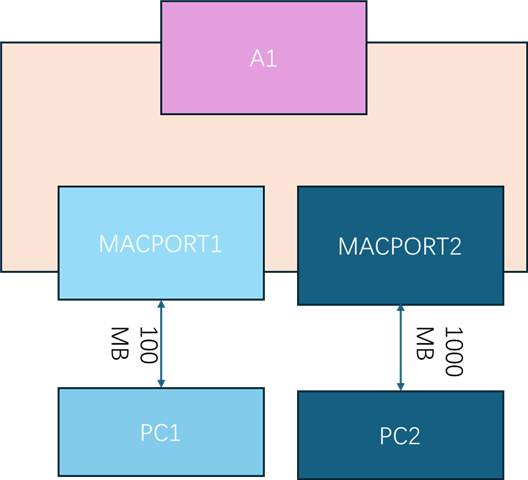
On the TDA4VH platform ethfw CPSW9G for SDK0900, the hostmacport, macport1, and macport2 are configured within VLAN8.
The physical interface connected to MACPORT1 operates at 100MB,
while MACPORT2's connected PHY operates at 1000MB.
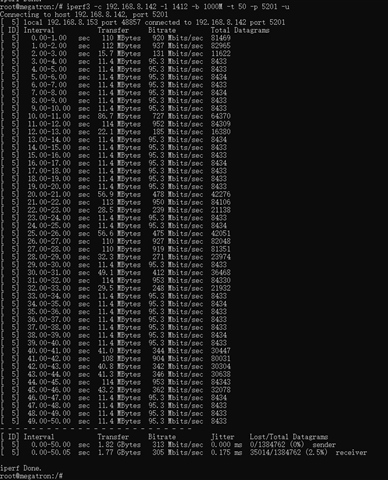
During our bandwidth testing of MACPORT2,
we encountered a bandwidth limitation issue where the throughput was restricted to 100MB
TDA4VH LINUX run command"iperf3 -c 192.168.8.142 -u -l 1412 -b 1000M -t 50" for UDP, However, TCP can reach 1000MB.
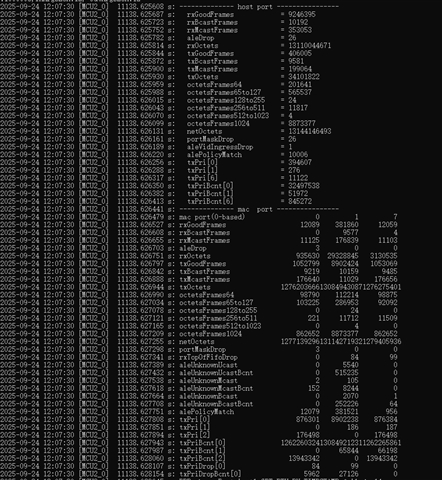
During UDP transmission, the count of octestframes1024 on MACPORT1 (0) increases sharply as MACPORT2 (1) grows.