Part Number: SK-AM62B-P1
Hello,
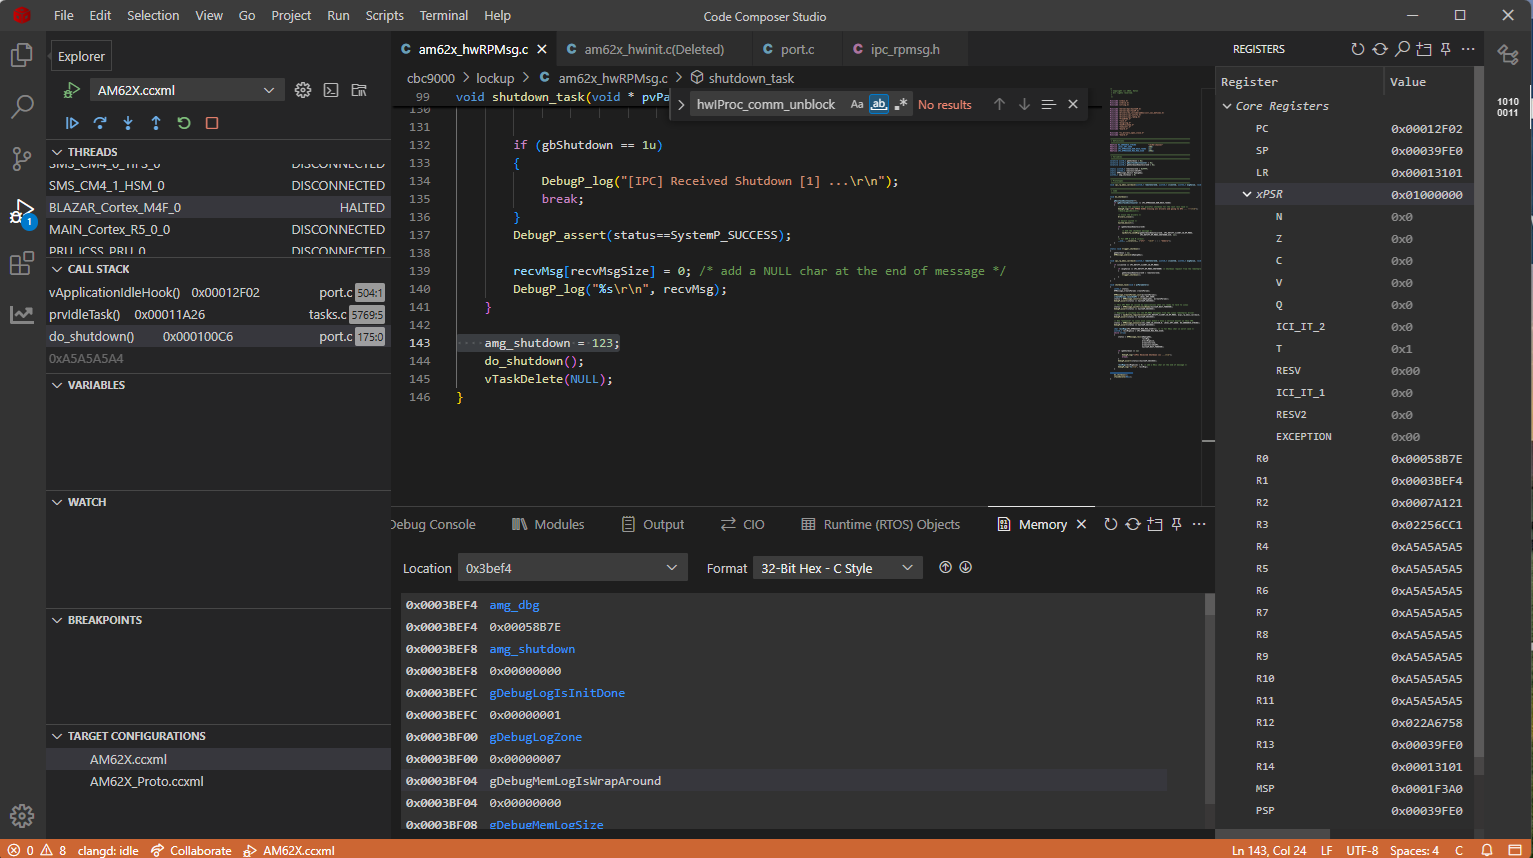
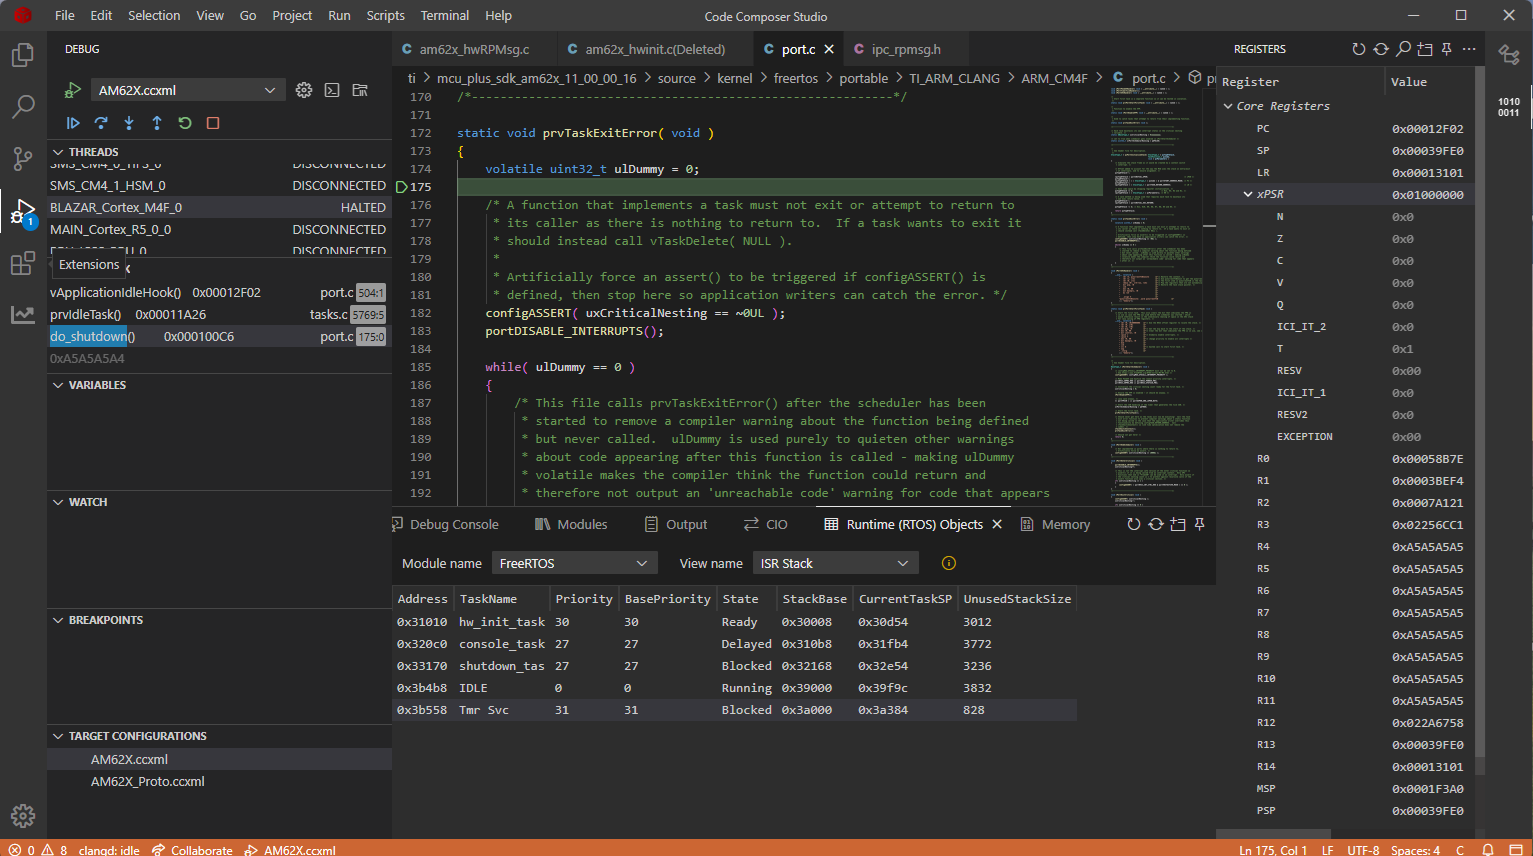
I'm trying to debug a problem in my application where the M4 boot would lockup in the middle of a log print. I'm seeing this on my production board, and also on the AM62x evaluation board. On the eval board, all I'm doing is run a script that iterates starting/stopping M4. Sometimes I would get the lockup within 20 reboots, but sometimes it will take over a 100 reboots to hit it. When I attach the CCS debugger, I see this call stack (see attached image). I'm not sure what is the 0xA5A5A5A4 at the bottom of the call stack. Is this indicating memory corruption? The next on the call stack is my do_shutdown function, but I know this function wasn't called because I added a flag right before I call do_shutdown and the debugger is showing that flag not set. Is this call stack telling me something, or is it pointing to memory corruption and it shouldn't be trusted? Also, a few more questions:
- I can only see the call stack of the active task, which in this case is the IDLE task. Is there a way to see the call stack for my other tasks?
- In the Register view, how do I get it to show the fault register (CFSR)? I checked it in memory @ 0xE000ED28 and it's all 0s.
Thanks.
-Ayman