This thread has been locked.

If you have a related question, please click the "Ask a related question" button in the top right corner. The newly created question will be automatically linked to this question.

How to speedup my project running on C6678

Other Parts Discussed in Thread: SYSBIOS

Dear TI Employee,


  The situation is that the processing time doesn't meet my requirement.

  In the document SPRS691C page 18. 

  It tells us " a very high level of parallelism that can be exploited by DSP programmers through the use of TI's optimized C/C++ compiler "

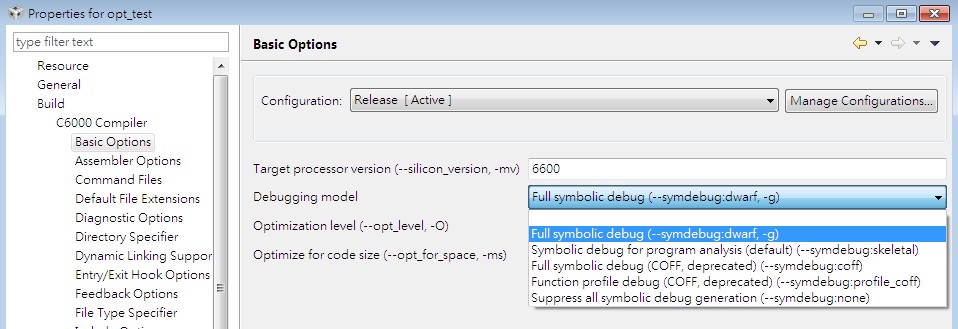
  So, my optimization level  is set to o2

  But is there anything that can help me make my project run faster ?

  Or is there anything  I missed ?

  Does the .out file control the eight functional units or I should control them ?

  By the way, I am writing C code.

Regards,

Matt


  • Hi,

    In general, about me the compiler does a great work in optimizing the code, but seldom it needs some helps, and  you have to give it some hints.

    You can set the optimization level to 3 (Basic Options) and Optimize for speed to 5 (in Optimization options). Also, if you are compiling in debug, the set "optimize fully in presence of debug directive" (in Runtime mode options).

    There are a lot of other option You can try: read:

    • SPRABF2 Introduction to TMS320C6000 DSP Optimization
    • SPRA666 Hand-Tuning Loops and Control Code on the TMS320C6000
    • SPRU198K TMS320C6000 Programmer’s Guide


  • Hi Matt,

    I think there are 2 ways to consider:
    1. Actually, in many situation, the optimization of compiler is not enough. You should write assembly code for highly-density-calculation part of your code. Or take advantage of DMA to speedup the transfer of data if there exist plenty of data access requirement. There is Time Stamp counter module inside the corePac, you can utilize them to measure the cycle consumption of each module of your application and locate the most cycle consumers. Then optimize these modules according to their attribute(Computationally intensive,Data access intensive or combination of the two).
    2. You know there are 8 C66x cores in C6678, so we can simply suppose the performance could be speeded up by 8 times than one core if they are do the same thing. Now you can have a look at your project and think about does it suitable or convenient to deploy onto multi-core? There are different methods to simply achieve that, one is for deploying the same program for every core,but maybe with different input data. And the other is divide the whole work into several steps like a pipeline flow, such as A->B->C->D..., so A can put into Core0, B->Core1 and so on. TI has provided a MAD utility to realize the deployment of multicore application very effectively, you can learn it at http://processors.wiki.ti.com/index.php/MAD_Utils_User_Guide.

    Just for reference.

    Allen

  • Thanks Albert and Allen,  good posts.

    I'd like to say that, you should consider the techniques in the C optimization guides, 'unrolling loops', using pragma's, etc. to help free up the compiler to do it's job optimally before writing hand assembly, and then I'd suggest using linear assembly, first.

    The compiler can give you very optimal results if you free it up to do so as described in the guides and this can take much less time than hand optimizing routines.  After you have a system up and running, then you can profile and go back and optimize routines that are consuming lots of cycles or are called extremely frequently.

    Best Regards,

    Chad

  •   Thanks Albert , Allen and Chad.

      I will study the document

      I have a question about optimization level o3.

      If I set o3, the project fails while it works fine at level o2 .

      Is there any reason ?

      Thanks!


  • Matt,

    It shouldn't fail at any optimization level.  Can you clarify how it's failing?  That would probably be more of discussion for the C/C++ Compiler forum section though.  If you provide details on how it's failing there, they may be able to better assist.

    Best Regards,
    Chad

  • Matt,

    I am not sure what do you mean by saying it fails at Optimization level 3. Sometimes its Eclipse fault as well, it crashes and it happens with me many times as well. can you give any particular error message you are getting or anything special you have done so it is failing.

    One more thing,Alberto and Allen, can you suggest something if you have used linear assembly to access cores and all . Any Example projects or something like that. I  am also working on that.

    Thanks.

  • I have one more suggestion. You may find recommendation to read produced assembly in compiler guide. Don't neglect, sometimes it really helps. Many times reading assembly output I saw strange instructions. Then I realized, that, for example, mixture of signed and unsigned types required extra instruction, or wrong types were taken to perform multiplies. Sometimes I saw that loop was overloaded with shift operations, so I could use expand intrinsic to rebalance some load to multiplier unit. Also read compiler advice files. That what compiler can tell you.

    Another side, which I believe must be the first, I proper data placement, which would allow SIMD instructions utilization. Not to forget marking with const qualifier on pointers to input data, which actually don't change in your loop. Finally, as was suggested above, you may think about multiple cores.

  • Hi Arun,

    What do you mean that use linear assembly to access cores and all?

    Allen

  • Hello Allen,

    as per your post, I was thinking Might be you have accessed registers of each cores something like that by the linear assembly. Actually I am trying to do that so I can put my data in it. So I was thinking if you can help me out with it or if you can suggest some examples for those linear assemblies if you have accessed registers or memory sections separately.

    Thanks. 

  • Hi Arun,

    Actually, linear assembly is a good way to improve the performance of computation intensive code while the writing difficulty is lower than the direct assembly code. I will suggest you to go through the chapter 4.3 of C6000 optimizing compiler UG. And there is also a complete example of linear assembly code in that section.

    In linear assembly, you don't need to assign the register explicitly and consider which register is available when you want to occupy some of them to do calculation. Therefore, you can't use linear assembly to access the specific register because the assignment is handled by the assembler. So if you want to access a dedicated register such as A6 or B8 and so on, you need write the normal assembly code(with a file extension .asm rather than .sa of linear assembly).

    Allen

  • Matt Wu said:

      If I set o3, the project fails while it works fine at level o2 .

      Is there any reason ?

    It is hard to give hints about this without more info of what do you mean with "fails". I suggeste You to begin by isolating the performance critic code, optimize only this and look at what append.

    In my experience, one common problem with optimization is the coherence of the variable shared between multiple thread of executaion (OS theread and also interrupts handler). Shared control variable should always be declared "volatile".

  • Hello Allen,

    Thanks for reply . Yes, I have read section 4.3. Well, If I would say How would I know that only data's I have is in accessing through registers. I mean We can see every details about it by linker.cmd file that where our every part is. And, you are saying Normal Assembly, As far as I know It is very difficult to write assembly for registers. Share some experience or examples if you have in which we can accessing assembly with our c code or suggest me something else then if you have some other idea. For you knowledge, I am working on performance and trying to see the difference in every part of memory.

    Thanks and Regards,
    Arun 

  • Hi Arun,

    All datas can be accessed by DSP through registers, so before to do some computation on memory's data, you must load them into registers.

    Could you explain explicitly what are you working on? Do you just want to test the performance difference when allocating your data section to different memory  segment such as DDR3 or MSMCRAM?

    Allen


  • Hello Allen,

    On Simple scale yes, I want to see difference after allocating to different memory sections from register to L1 then L2 then MSMC and DDR3. Simply for matrix to MAtrix multiplication.

    On large scale I am actually working on DSP architecture for my research under Energy Efficient computing. can't discuss more details on it as It will be out of scope or subject here.
    As you said allocation to registers, then do you mean individual allocation to each registers or anything else?Or, Declare it as registers and It will automatically go into it?

    Thanks and regards,
    Arun 

  • Before going the Linear Assembly road consider using :

    a) Intrinsics (see the compiler guide for how to use them)

    b) #pragma MUST_ITERATE

    c) Manual unrolling

    d) keyword restrict

    and look at the .asm file produced (you have to specify in the compiler options that you need it) to see how the compiler optimize your code and mostly, where it fails to unroll your loops for example.

    use a macro to get the number of cycles

    (we used this : 

    #define Start_profile() TSCL=0; \
    t_start=TSCL

    #define Stop_profile() t_stop = TSCL; \
    t_overhead=t_stop-t_start; \
    printf("cycles = %d\n",t_overhead)

    )

    CM

  • Hi Arun,

    There might be a misunderstand of registers. They are the bridge of DSP and data in memory. Any data(located in memory) that needed for computation MUST be loaded into registers firstly. So except for assembly code, you can not manually allocate the registers or let the compiler allocating it automatically.

    Allen

  • Dear all,

      I have read sprabf2 Introduction to TMS320C6000 DSP Optimization

      I don't know how to see the details like "Unroll Factor"  "Loop Carried Dependency Bound"   and aslo the details in ex.9

      And I have tried some examples  (ex.15)  

      There are two problems  I encountered.

      First, the CPU cycle count doesn't match the value in the document. 

      It's about 2 to 3 times of the value in the document. 

      The cycle count is measured by CCS5. (Run->Clock->Enable   and  set breakpoint ) 

      Second, the function dotp2 doesn't decrease the cycle count.

      What's wrong with my project ?   It's weird.

    4540.opt_test.zip

    Thanks


  • "I don't know how to see the details like "Unroll Factor"  "Loop Carried Dependency Bound"   and aslo the details in ex.9"

    You find these elements in the .asm produced by the compiler.

    "The cycle count is measured by CCS5. (Run->Clock->Enable   and  set breakpoint ) "

    The code to measure cycles I gave you is accurate. TI employees can confirm that too. I don't know about your method.


    Make sure you use O3 with no debug at all


    In your .asm look for lines like this :

    ;*----------------------------------------------------------------------------*
    ;* SOFTWARE PIPELINE INFORMATION
    ;* Disqualified loop: Loop contains control code
    ;*----------------------------------------------------------------------------*

    which is something you must avoid

    If software pipelining works well you'll have something like this :

    ;*----------------------------------------------------------------------------*
    ;* SOFTWARE PIPELINE INFORMATION
    ;*
    ;* Loop found in file : ../UserLib.c
    ;* Loop source line : 738
    ;* Loop opening brace source line : 739
    ;* Loop closing brace source line : 741
    ;* Known Minimum Trip Count : 8
    ;* Known Max Trip Count Factor : 8
    ;* Loop Carried Dependency Bound(^) : 6
    ;* Unpartitioned Resource Bound : 1
    ;* Partitioned Resource Bound(*) : 2
    ;* Resource Partition:
    ;* A-side B-side
    ;* .L units 0 0
    ;* .S units 0 0
    ;* .D units 0 2*
    ;* .M units 0 0
    ;* .X cross paths 0 0
    ;* .T address paths 0 2*
    ;* Long read paths 0 0
    ;* Long write paths 0 0
    ;* Logical ops (.LS) 0 0 (.L or .S unit)
    ;* Addition ops (.LSD) 0 0 (.L or .S or .D unit)
    ;* Bound(.L .S .LS) 0 0
    ;* Bound(.L .S .D .LS .LSD) 0 1
    ;*
    ;* Searching for software pipeline schedule at ...
    ;* ii = 6 Schedule found with 2 iterations in parallel
    ;* Done
    ;*
    ;* Loop will be splooped
    ;* Collapsed epilog stages : 0
    ;* Collapsed prolog stages : 0
    ;* Minimum required memory pad : 0 bytes
    ;*
    ;* Minimum safe trip count : 1
    ;*----------------------------------------------------------------------------*

    if you haven't already, read Hand-Tuning Loops and Control Code on the TMS320C6000 it will guide you through this.

  • Matt,

    Since you have an immediate dependency (the result of iteration i is dependent on iteration i-1.)  I'm not sure if it's going to unroll for you.

    You're code:

    int dotp(short *m , short *n )
    {
        int i;
        int out=0;

        //_nassert((int)m%8==0);
        //_nassert((int)n%8==0);
        //#pragma MUST_ITERATE(256,256,4)
        //#pragma UNROLL(4)
        for(i=0;i<256;i++)
            //out=out+_dotp2(m[i],n[i]);
            out=out+m[i]*n[i];
        return out;
    }

    That said, you can manually unroll this.

    int dotp(short *m , short *n )
    {
        int i;
        int out=0;
        int out1=0;
        int out2=0;

        for(i=0;i<256;i+=2) {
            out1 = out1 + m[i]*n[i];
            out2 = out2 + m[i+1]*n[i+1];
        }

            out = out1 + out2;
        return out;
    }

    or better yet since the loop count is an easy multiple of 4, you can unroll it some more.

    int dotp(short *m , short *n )
    {
        int i;
        int out=0;
        int out1=0;
        int out2=0;
        int out3=0
        int out4=0;

        for(i=0;i<256;i+=4) {
            out1 = out1 + m[i]*n[i];
            out2 = out2 + m[i+1]*n[i+1];
            out1 = out1 + m[i+2]*n[i+2];
            out2 = out2 + m[i+3]*n[i+3];
        }

            out = out1 + out2 + out3 + out4;
        return out;
    }

    Best Regards,
    Chad

  • Hi,

    I haven't try your example, but the ex.15 from sprabf2, on the simulator, runs in 92 cycles (short), including the call to dodp(), that match 91 cycles declared in the documents (the docs say that the cycles count has been taken on the simulator).

    On the EVM, L2SRAM, the same code runs in 260 cycles at the first call (load code and data in L1 cache) ant in 160 cycles the second (data already in the L1).

  • Alberto,

    the first time is going to be caching related.  There may also be some less than optimal 'loading' of the data.  Doing the alignment assertions should help.  Also, make sure you're using at least the -O2 compiler option.

    Best Regards,

    Chad

  • Thanks for your help

    Clement,

      I doesn't understand " use O3 with no debug"  which also reference in the document.

      Which one should I select ?

       I also take your advice on measuring cycles.

       But the t_overhead printed is a very large number.

      5140.opt_test.zip

      Chad,

        My code is the same as in the document.

        So, I think I should get the same results such as cycle count .unrolling....

        The result of mine is almost close to Alberto's on the EVM.

        Is it regular that the result on EVM will larger than the value in document ?

        And there is a question, the function dotp2 doesn't decrease the cycle count .


       All I want to do now is to get an almost same result as in document 

    Thanks


  • Select first line, which is blank, right above 'Full symbolic debug'. From this perspective, debug configuration is to specify -g option, while release is to specify none.

  • Thank you

    I have chosen the blank line but.....

  • If the blank one doesn't work, use the last one.

    Here's how you should use cycle count :

    #include <xdc/std.h>
    #include <stdio.h>
    #include <xdc/runtime/System.h>
    #include <ti/sysbios/BIOS.h>

    #define Stop_profile() t_stop=TSCL;\
    t_overhead=t_stop-t_start;

    #define Start_profile() TSCL=0;\
    t_start=TSCL;

    unsigned int t_start;
    unsigned int t_stop;
    unsigned int t_overhead;

    int dotp(short *m , short *n )
    {
    int i;
    int out=0;

    for(i=0;i<256;i++)
    //out=out+_dotp2(m[i],n[i]);
    out=out+m[i]*n[i];
    return out;
    }
    Void main()
    {

    int i;
    int sum=0;
    short m[256];
    short n[256];

    for(i=0;i<256;i++) {
    m[i]=i; n[i]=i;
    }

    Start_profile();

    sum=dotp(m,n);

    Stop_profile();

    printf("t_start=%d t_stop=%d t_overhead=%d\n",t_start,t_stop,t_overhead);

    }

    It should be better now.

  • Thank you !

    The last is also fail......

  • Hi,

    If you remove the symbolic debug info, the debugger is not longer able to show you the associated source code. This is normal. You should left the default symbols generation option but for the optimized compilaiton unit. You cannot step in the optimized code, but you can step in the non optimized (for instance, the main routine tht calls your optimized routine). Note that  the optimization options cab ne tuned on a file-by-file basis and also on a directory-by-directory basis.

    Make a directory for your optimized code, place under that directory all the file you want to optimized and then play with optimization option only on that direcotry, leaving the main unoptimized.

    Anyway, it is not necessary to disable the debug symbols generaiton, You can set the option "Optimize fully in presence of debug directive" in the "Runtime Model Options" panel. Again, applay it only to source file/directory to be optimized.