This thread has been locked.

If you have a related question, please click the "Ask a related question" button in the top right corner. The newly created question will be automatically linked to this question.

OpenMP slow performance

Hello,

when I use OpenMP on C6678EVM the operation is much slower than without OpenMP (than single core operation). Much: At least 1000 times.

I tried:

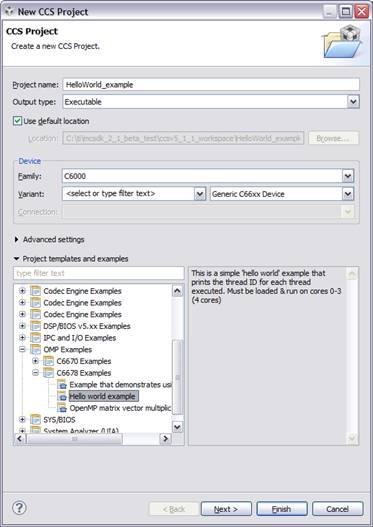
- Copy OpenMP Image Processing Demo to my CCS Workspace (of MCSDK Beta 2.1)

- Delete everything except the mcip_master_main.c file

- Insert two for loops. One with and one without OpenMP
#pragma omp parallel for shared(a) private(i)

- Second test: Test a "realworld" algorithm (medical image registration)
 #pragma omp parallel for reduction(+:SSD)

Result: The first algorithm takes much (>1000 times ?) longer to compute. The second one never returns (don't know wether it is too slow or wether there is another issue).

I wonder how this can be, because I use the unchanged OpenMP-Image-Processing demo. Any ideas ??? Must calculation take place in a special (ly initialized) task ?

Compilation was as release binary, onboard XDS100 is attached while testing.

Thank you.

Best regards,
Roelof Berg


  • Hi Roelof,

    I will look into this and try and get back to you tomorrow.

  • Hello,

    I made the "realworld" algorithm working and it is about 2 times faster on 8 cores. (I don't use stuff like #pragma atomic, only #pragma reduction).

    Don't know why the for-loop-example takes longer. Maybe I didn't manage to cheat the debugger for not optimizing the non-openmp-for-loop. However, as the realworld-example is speed up, OpenMP seems to be working correctly now.

    One thing still makes me wonder. When I copy my algorithm into the NDK hello world example the execution time is 25s. When I copy it into the OpenMP-Image-Processing example it is 205s without and 105s with OpenMP. By the way on my local Laptop it is 2.5 s.

    I wonder a bit about the 5 allways occuring  at the last digit :) But that is not important. I wonder why the same calculation in OpenMP-Image-Processing demo takes so much longer. Probably NDK and ImageProc differ in DDR3/L2 configuration somewhere ?

    Question: What is a good starting point for figuring out, why the algorithm is about 10 times slower (wo. OpenMP) when run inside code derived from the Image-Processing demo (instead of from the NDK hello world demo) ? (Both were release builds).

    Thanks.

    Best regards,
    Roelof

  • Hello,

    I raised performance of the 8-core solution to 33s now. Let me summary my current situation:

    Algorithm execution time:

    Laptop: 2,5s
    DSP based on NDK HelloWorld with 1 core: 25s
    DSP based on OpenMP ImageProcessing with 1 core: 205s
    DSP based on OpenMP ImageProcessing with 8 cores: 33s

    Question: Why is the same algorithm so much faster in the project which is not OpenMP utilized ?

    One difference comes to my mind: In the OpenMP version I start no task, I execute directly in main(). In the faster version based on the NDK sample I create my own task with priority OS_TASKPRINORM.

    I did not change the .cfg files myself, I use the default. cfg files. Furthermore I allocate the processed bulk memory by a static variable:

         uint8_t gpRVecStaticMemory[300000];

    (When I use the way of Image-Processing-Demo which is

       Memory_alloc(DDR_HEAP, giTVecStaticMemorySize, MAX_CACHE_LINE, NULL);

    I see no difference.). L2Ram seems to be too small, I see an error of having only 0x60000 L2 when I tried to allocate the processed bulk memory in L2Ram.

    -----------------------------------------------------

    However, I didn't explicitely defined L2Ram in the NDK sample (the fast one). At leas I'm not aware of that. So I assume both applications operate on DDR3 bulk data. But why is the OpenMP utilized version about 10x slower ?

    (Note: I execute both applications while being onboard USB-JTAG connected to a EVMC6678L).

    Thanks a lot,
    (I have to give my boss some preliminary performance data the next days. When I have to tell him, an 8 core DSP needs 10 times longer to calculate than my old laptop, he won't be so amused ... I hope, there's a quick solution for this topic possible.)
    Roelof


    NDK-Sample-Config-Vs-10xSlower-OpenNP-Config.zip
  • Hi Roelof

    For an apples-to-apples comparison you should compare the following:

    1. Image Processing Demo without OpenMP on 1 core (use project at C:\ti\mcsdk_2_01_00_02\demos\image_processing\serial folder) v/s Image Processing Demo with OpenMP on 1 core  (C:\ti\mcsdk_2_01_00_02\demos\image_processing\openmp)

    2.  Image Processing Demo without OpenMP on 8 cores (use project at C:\ti\mcsdk_2_01_00_02\demos\image_processing\ipc folder) v/s Image Processing Demo with OpenMP on 8 cores

  • Hello,

    thanks for the answer. I understand. That would be the comparison of with and without OpenMp.

    However, I have an algorithm here (which has to go into production at some day). This algorithm runs as written above much faster (about 10 times) when copy&pasted into the NDK sample application than when copy&pasted into the Image processing demo (when I don't use OpenMP). It is not so much code, maybe 50 lines of self-contained code without any operating system interaction (like barriers).

    I wonder what can be the reason that exactly the same simple piece of code runs 10 times slower inside the Image-Processing example ?

    I can give it a try to paste the algorithm to the IPC-Version of the image-processing example to see if it is also 10 times slower in that version.

    Any idea ?

    Best regards,
    Roelof


  • There could be multiple reasons, because the two demos (NDK v/s Image Processing) are written for different purposes and setup differently. It depends on what your algorithm does and how it relates to what's done in the demo. It would be better if you compared the IPC-version of Image Processing. 

    What is your end objective here? If you are just trying to evaluate the performance of your algorithm with and without OpenMP, I'd suggest starting with a fresh plate. You can leverage the simpler OpenMP helloWorld example as a starting template and build on that.

  • The algorithm processes two image buffers with size of 300000 byte each. It is just a twice nested for-loop doing some hand written mathematics. It does not interact with the system at all. Basically matrice calculations.

    for (;i<300000;i++)
        for (;ii<300000;ii++)
            combine the two buffers in some way, calculate a bit, sum up the result in a single float at each iteration, don't interact to the system
         }
    }

    That's everything. I really wonder, how  this piece of code can have so different execution times in both sample applications.

    My objective is to find out how fast 4 DSPs with in total 32 cores C6678 DSP can calculate this special algorithm. If the execution time (without optimization in the first step) on a single DSP comes close to 3 seconds, the DSP option will probably be chosen for the medical products of our business partners. If it will be 20 seconds, the DSP evaluation will unfortunately be stopped.

    Now: This very piece of code can be executed on one core in 25 seconds (when pasted into the NDK sample). So I hoped when utilizing 8 cores I would end up in about 25/3=3.1 seconds.

    I need the speed of the execution in the NDK sample for this particular algorithm and also the possibility to execute on 8 cores to archieve my goals. If possible I'd prefer OpenMP over hand written IPC.

    It's 0:49 here now, I have to go home ... I'll keep in touch tomorrow.

    Best regards,
    Roelof


  • Roelof,

    Although I do not know much about OpenMP or about the specific examples that you are pasting your code into, I still want to jump into this discussion. I want to know more about OpenMP, but that is about 8th on my list, and that is not very high.

    But what I do know are performance and some of the trade-offs for performance.

    My first thought is that OpenMP should not be getting in the way of your performance. It seems to be, but I do not believe you are doing similar enough examples to compare them that way. With such large loop counters, especially when nested to square the number of calculation passes of the inner loop, nothing in the O/S should have any effect on your algorithm.

    My second thought is "without optimization". You will get substantially better performance by turning on even a little bit of optimization in the compiler. Maybe you mean no handwritten algorithm or assembly code optimization? Or do you mean you are using the Debug build with -g and with no -o  in the compiler options?

    Since you are pasting the same code into multiple example projects, and getting different results, these are the things I can imagine that could be affecting your results:

    1. Different example projects have different compiler build options. You might be getting a little optimization in some cases and not in others.

    2. Different example projects may have different cache configurations. If one of the projects uses all CorePac memory at max cache settings, you may get different performance numbers than another that has cache turned off or another that uses internal memory as SRAM.

    3. Different projects may place the program and data in local L2 or MSMCSRAM or external DDR3. That, depending on the cache settings, can dramatically affect your performance.

    If you can offer any insight into the addresses where your program and data reside for the different examples, that could help with rationalizing your performance differences. Looking for your pasted components in the .map file will tell you the addresses where the components are placed.

    Regards,
    RandyP

  • Hi Roelof

    As Randy mentioned, the NDK and OpenMP Image Processing examples are setup differently and you will get different results for the possible reasons he has listed. As I mentioned earlier, I would suggest that you start with a clean slate and build your example from there on.

    For your objective wrt OpenMP implementation, I'd suggest the following route:

    1. Create a New Project based on the OpenMP helloworld template:
    • Open CCS (preferably with a new workspace).
    • Open File->New->CCS Project and in the project name field enter HelloWorld_example (or whatever name you desire for the project)
    • In the CCS project window, select Project Type as C6000
    • In the New CCS Project, select Device Variant: as Generic C66xx Device.
    • In the Project Templates window select “OMP Examples à C6678 Examples à Hello world example” and hit Next. See figure below.
    • Verify your RTSC settings. The following packages should be selected: BIOS, IPC, OMP, PDK, and MCSDK

    2. Next, build this project as-is. The project should build successfully. You might see a warning saying "warning #10247-D: creating output section ".TI.tls" without a SECTIONS specification." You can ignore this warning. Next load and run this project as-is to ensure that it runs as expected. You should see a hello world printed from each core.

    3. Now let's get to your code, starting with input/output buffer allocation. If you use malloc to allocate your buffers, they will be allocated in DDR. You should be able to get better performance numbers if you place your input and output buffers in MSMC. You can follow the steps here to place your input buffers in MSMC. To understand this, first look at the platform file showing the memory map for this OpenMP example. To do this, go to CCS Debug View and view the RTSC Platform as shown in this snapshot below:


    Now click Browse and select the following directory "C:\ti\omp_1_01_02_03_beta\packages." Once you do this, you should see an option under "Package Name" called "ti.omp.examples.platforms.evm6678" as shown in the snapshot below:

    Once you click "Next" you will see the memory map as shown in the snapshot below:

    As you can see in the memory map above, there is a region called MSMCRAM_NOCACHE. Note that this region of MSMC is ~3MB in size. Some of this memory is used to store OpenMP runtime variables, etc. However these do not require much space, and since your input buffers require only 300KB x 2 = 600KB, you should be able to use this MSMCRAM_NOCACHE region to allocate your buffers. To do this, you will need to add the following in your .cfg file:

    Program.sectMap[".inputbuff"]  = "MSMCRAM_NOCACHE";

    In your helloWorld.c file you can place the buffer in this region as follows:

    #pragma DATA_SECTION(pBuffer_1, ".inputbuff");
    #pragma DATA_SECTION(pBuffer_2, ".inputbuff");
    #pragma DATA_ALIGN(pBuffer_1, 128);
    #pragma DATA_ALIGN(pBuffer_2, 128);
    char pBuffer_1[300*1024];
    char pBuffer_2[300*1024]; 

    You can use a simlar approach to add the output buffer in MSMC too, as long as it isn't too large. 

    4. Remove the helloworld printfs and add the rest of your code in its place in the helloworld.c file. 

    (If you are also looking at experimenting with larger datasets, you might also want to look into the use of DMA and use a ping-pong buffer scheme to move input/output data from DDR to MSMC/L2 and MSMC/L2 to DDR, respectively.)

    5. Please also keep in mind the suggestions that Randy has mentioned in his note above.

    Since you are working on a medical imaging algorithm, I should mention that you might also want to look at the Medical Imaging Software Toolkit, which has several medical imaging algorithms, optimized for TI DSP with test projects that run on the C6678, and documentation, including benchmarks. See http://www.ti.com/tool/s2meddus to download it free-of-cost. There is also a system-level implementation of ultrasound and OCT signal processing available, details at http://processors.wiki.ti.com/index.php/MIDAS_Ultrasound_v4.0_Demo. There is also the more general image processing library, which is part of the MCSDK install (imglib_c66x_3_1_0_1). 

  • Hi,

    I'd like to add one more thing.
    Nested loops are not good idea.
    Instead:
    for (;i<300000;i++) 
        for (;ii<300000;ii++)        
            //combine the two buffers in some way, calculate a bit, sum up the result in a single float at each iteration, don't interact to the system      } }

    Unroll loops instead, it usually make program much faster:

    k=300000*300000;
    for (;i<k;i++)
    {
       //all processing in one loop, calculate "i" and "j" if needed :
         // my_i = i / 300000;
         //    j     = i % 300000;
    }    

    ------------

    Regards,
    Marko.


  • Hello,

    thank you for the detailed answers. Excellent. It will take me some hours to work through the suggesions and to set up a "clean" project as suggested.

    Regarding the questions about optimization: When I wrote "non-optimized" code I indeed meant code that is compiled with compiler-optimizations enabled, but code that isn't handwritten assembler-optimized yet.

    Build optimization Settings are equal for both projects, I double checked that. But the platform settings differ significantly:

    Fast version:
    Code: L2
    Picture data: DDR3 (so the fast version might have potential to become even faster)

    Slow version:
    Code: MSMCSRAM
    Picture data: MSMCSRAM

    Having the algorithm .text in L2 in the fast version is very suspicious to me. I will check wether the fast version will also be 10 times slower when the .text is in MSMCSRAM. If I remember right, there are some constraints between OpenMP and configuring the platform to MSMCSRAM instead of L2 - if have to read that part of the manuals again.

    Also thank you for the loop unrolling suggestion. I will change this as soon as I have a multicore-enabled and still fast platform configuration.

    Best regards,
    Roelof

  • I decided to do some kind of "destructive" test first before building my own platform. I try to make the faster platform (the NDK-sample-based one) slower. If I find a setting which makes it 10 times slower this one will be suspicious of causing the slowdown in the slower platform (the OpenMP-sample-based one).

    Until now I wasn't able to make it slower. Even when I switched it from L2Ram to MSMCSRAM the performance remained good (also with a disabled cache). So it seems that the type of memory taken has no effect (at least no effect in the dimensions 10 times faster/slower).

    I will drop a note when I found out the cause. (I hope the DSPs are running at 1GHz, someone else reported one day that his EVM dropped down to 100 MHz.)

    Best regards,
    Roelof


  • Update:

    When I paste my code into ... it is ... :

    NDK-Sample: Fast
    OpenMP-Imageproc-Demo: Slow
    OpenMP-MasterSlave-Demo: FAST !

    (Picture data read from DDR3 in all three cases)

    To be honest my code contains a bit more than a duplicate for-loop. It was ported from windows. It is a socket, that receives data and then goes into the for loops. That's the reason why I allways try to paste the code into an example containing allready a working NDK environment.

    However. It should take me just a few hours to port from OpenMP to the way, the MasterSlave demo operates. For quick results this seems to be the nearest workaround.

    Thanks, for the support. I will send a message when (and if) the IPC version will be fast enough.

    Roelof Berg

  • Sorry, off course I meant:

    NDK-Hello-Sample: Fast
    OpenMP-Imageproc-Demo: Slow
    MasterSlave-Imageproc-Demo: FAST !

  • Hello All,

    I have some points from my side as well based on whatever work I have done on 6678.

    First of all, Roelof, As per my view OpenMP has nothing to do with the Speed of code whatever you are running, and It is quite obvious you are getting different speeds in different ways because memory sections divisions and cache are different for each of them and i think you can easily see it from linker file and also from RTSC one. Why I am saying this because When I was working on it for Performance of board for Matrix to Matrix multiplication, It behaves like that. Performance only depends on How Effectively you do data transfers among the memories sections , whatever threads you are using to divide your task should utilize memories section perfectly, because in my case It was the issue and because of that my performance was quite bad. Yes, make sure you flush out the Buffers which you have created on regular intervals then only it will hold new values otherwise problem will be same. I would suggest do not use any optimization's level,  try it without that and see the performance and later you can use compiler optimization's levels to improve much more performance. Don't use too many Nested loops, It will only eat your performance, make it simple. These are Just some of my experience which I have been through and It helped me alot.   
    Yes, DSP's are running at 1Ghz only, although you can change it if you want, but I am not sure how much feasible that would be.

    Uday Gurnani: I have one of my doubt question for you : as per your which you have shown for creating new fresh project and memory configurations in  this forum, I have checked you were using Blackhawk XDS560_v2 emulator I think. I have asked this question before as well, But didn't get any satisfying answer to that. So I am asking again here, Is XDS100v1 USB emulator which we have on 6678 DSP is this one slow as compared to other emulator, What I have felt is this one is quite slow especially if you are doing some big size or large chunk of data transfer from one memory section to other. Is it advisable if we are dealing with large size data to use external emulator like Blackhawk or others? Because sometimes for example for large matrix size and large FFT's it seems it hanged in between and Doesn't seems it is doing anything and took some weird time stamps. 

    Thanks and Regards,
    Arun 

  • Hello Ayrun,

    I will follow your suggestions when I will start the manual optimization. Thanks a lot for sharing your experience.

    If I understood it correctly, switching to OpenMP has a big impact on the whole platform and expecially on the memory regions (incl. stuff like "uncached regions"). So I agree to see the memory management as a good candidate for causing the slowdown. I suspect some kind of indirect connection between the slowdown and OpenMP, because OpenMP requires this kind of memory configuration that is (possibly) bad for the performance in my particular case. (By the way, I don't execute OpenMP, I just use a OpenMP compatible platform).

    What makes me wonder is that I was not able to slow down the fast versions by testing the same disadvantageous memory settings (e.g. Code from MCSMRAM instead L2) that OpenMP uses.

    Thanks,
    Roelof


  • Porting from OpenMP to "manual IPC" has effect. The platform is is now fast, NDK capable and the algorithm can be executed on all 8 cores. I assume, I will be in time for presenting the performance data tomorrow. Thank you all :)

  • Hi Roelof Berg

    What do you mean "porting from OpenMP to "manual IPC""? And how can I do this?

    Thanks

  • Hello Guohua,

    instead of utilizing my for-loop with OpenMP I split up the application into a master core and several slave cores. The master core assigns work to the slave cores (and also to itself) by using IPC (interprocess communication) and sums up the answers to a combined result. As IPC method I used message passing as shown in the TI sample ...\mcsdk_x_xx_xx_xx\demos\image_processing\ipc.

    Take care to use proper cache-invalidation and cache-writeback. For me it was a good practice to have a debug-compile-switch that executed all calculations on only one core. When I enabled this switch and received a correct result - but received a wrong result when I disabled it - I could be sure that I had an error in the cache handling.

    Porting from OpenMP to IPC took a few days and made the code more complicated. Also I had to deal with the MAD utilities for generating a multicore boot image. But the execution time was about 10 times faster if I remember right. Maybe because my algorithm was very sensitive to cache misses and by using OpenMP one skips some of the valuable caching capabilities of the C6678 gems ...

    Another option instead of message passing (or the multicore navigator) could be to use shared memory and some event-semaphores (or anything alike). I wonder if this would be even faster than the message passing approach of the given sample. At least I noticed that for very small loops calculating on one core instead of eight cores was faster, so I added an if-statement that skipped 8-core-IPC-calculation for small loops.

    Let's say you will spend up to two wheeks for the port (including bugfixing in your cache-sync-code, providing a multicore MAD-boot-image, and possibly one day to find out that you forgot to build the slave cores and built only the master - at least I spent such one ;) but as a result you will have a system with optimized cache-usage and full controll over all cores that should be faster than an OpenMP solution.

    Best regards,
    Roelof

  • Roelof Berg said:
    I assume, I will be in time for presenting the performance data tomorrow.

    So do you have any performance data available that you could share? I think both OpenMP and manual IPC data would be interesting for a lot of people.

    Kind regards,

    Roman

  • Hello Roman,

    we will publish the results in a scientific journal. Unfortunately we're not allowed to publish the results in other places beforehand. I try to remember to place the link to the paper to this email thread. (Unfortunately one will have to buy the results - unless someone would fund us an "open access" for the paper).

    In the final research we did not compare OpenMP to IPC. OpenMP was about 10 times slower so we moved to IPC - one can control the cache operation better when using IPC anyway. However that does not mean that OpenMP is allways 10 times slower (on C6678). Maybe it was related to our use-case and we didn't spent much effort to the OpenMP prototype as we felt that IPC will be the better solution anyway (the solution that takes mor effort - but gives more control).