


Hi,
I'm working on the Embedded Trace Buffers of the C6678 ( I use the EVM6678-Board). To get started I used the example projects (https://gforge.ti.com/gf/download/frsrelease/968/6254/Examples_4.5.zip) .
I started up with the code: ".\Examples\C6678\DSPTrace_TIETB_EDMA_Ex_CorePacN\" which first works fine. Then I modified line 71 of "TCI6xxExample.c" to:
#define N_APP_FUNCTION_RUNS 20
Now when I look at the collected data using the Trace Analyzer I get the Trace Status: "Bad trace information, current export frame processing aborted, Corrupted data found" @ time 31 and then a gap of 1513 cycles untill to the next valid data.
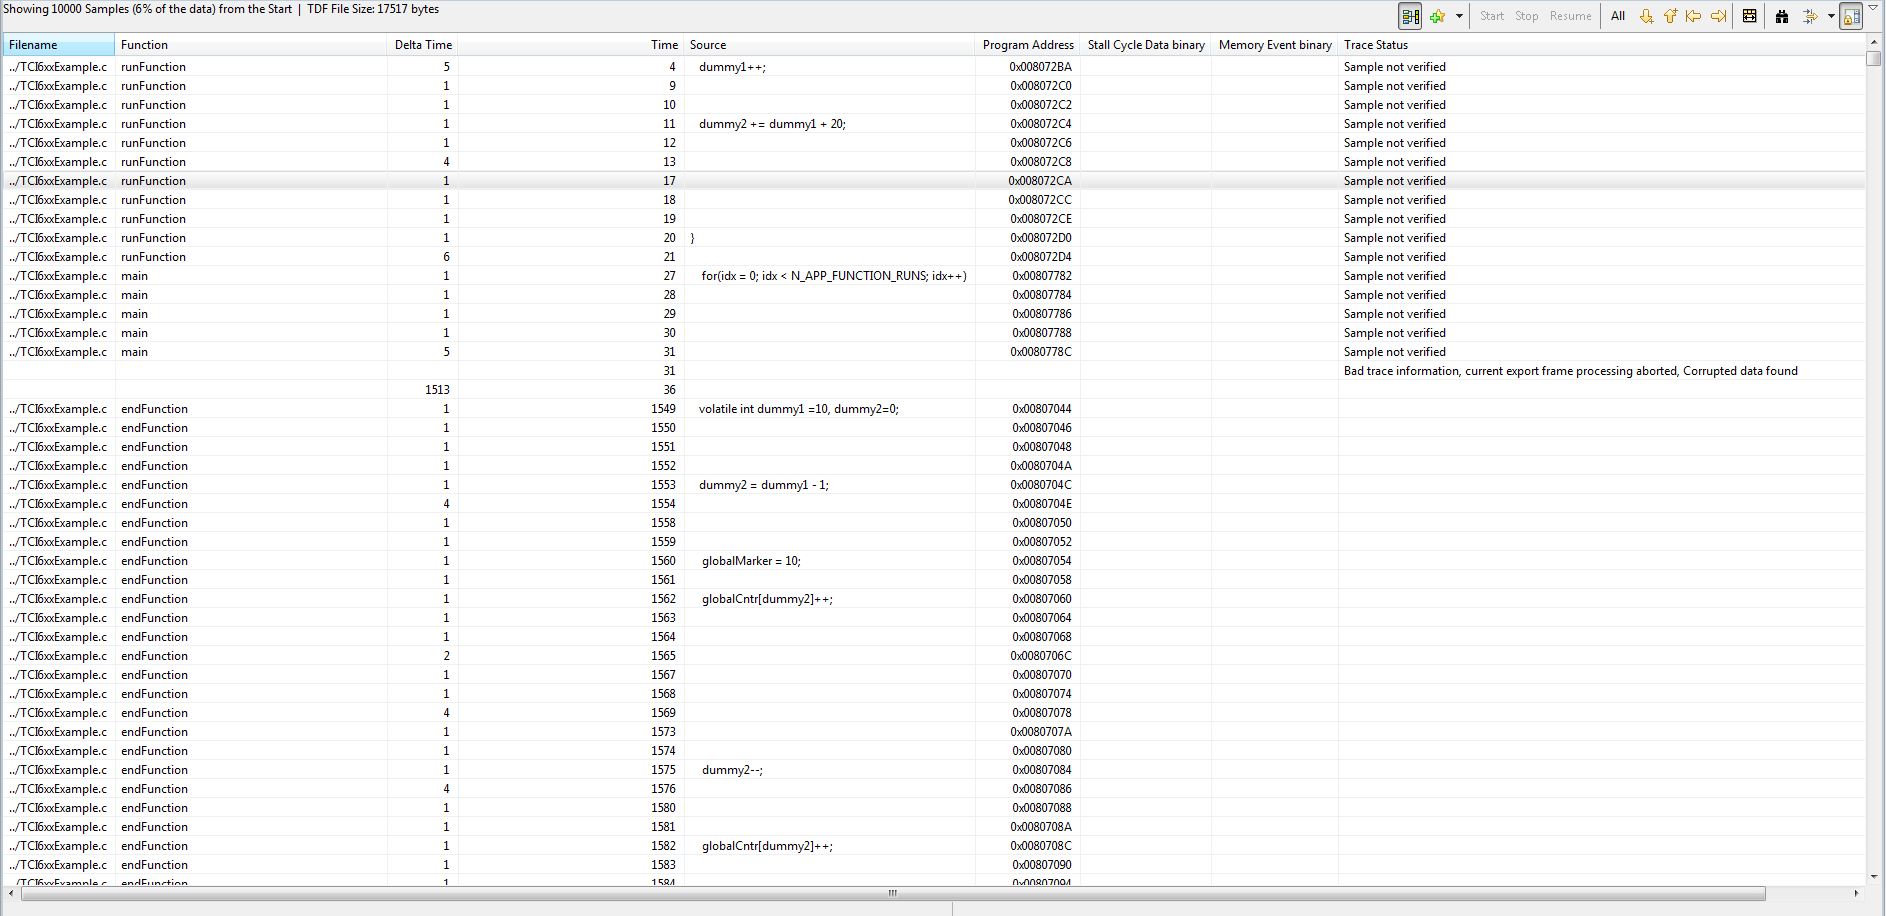
I had the same problem with my own code. But I cannot figure out any reasons for this. The error is reproduceable each time I load the programm. But if I change anything in the code (e.g. encapsulating functions, changing the calling sequence of functions,...) the errors might get worse, better, stay the same or disappear.
In my own code I realized that the Errors sometimes get worse, when I use a deep hierachy of functions E.g.
func1() -> calling func2() -> calling func3() -> calling func4()...
The example code works fine with N_APP_FUNCTION_RUNS =100
Is this just a representation problem or is the collected data wrong. For me it is completely impossible to debug this problem, since TI does not provide any specification/information about the ETB/tdf binary format. So I cannot verify the data.
I have attached a zip-file containing the collected data in binary and in tdf-format and also the modified .c file and the .out file.
I really need to get these things running in a reliable way.
Regards Fabian
