This thread has been locked.

If you have a related question, please click the "Ask a related question" button in the top right corner. The newly created question will be automatically linked to this question.

Program load hangs - never reaches symbol main

Hi,

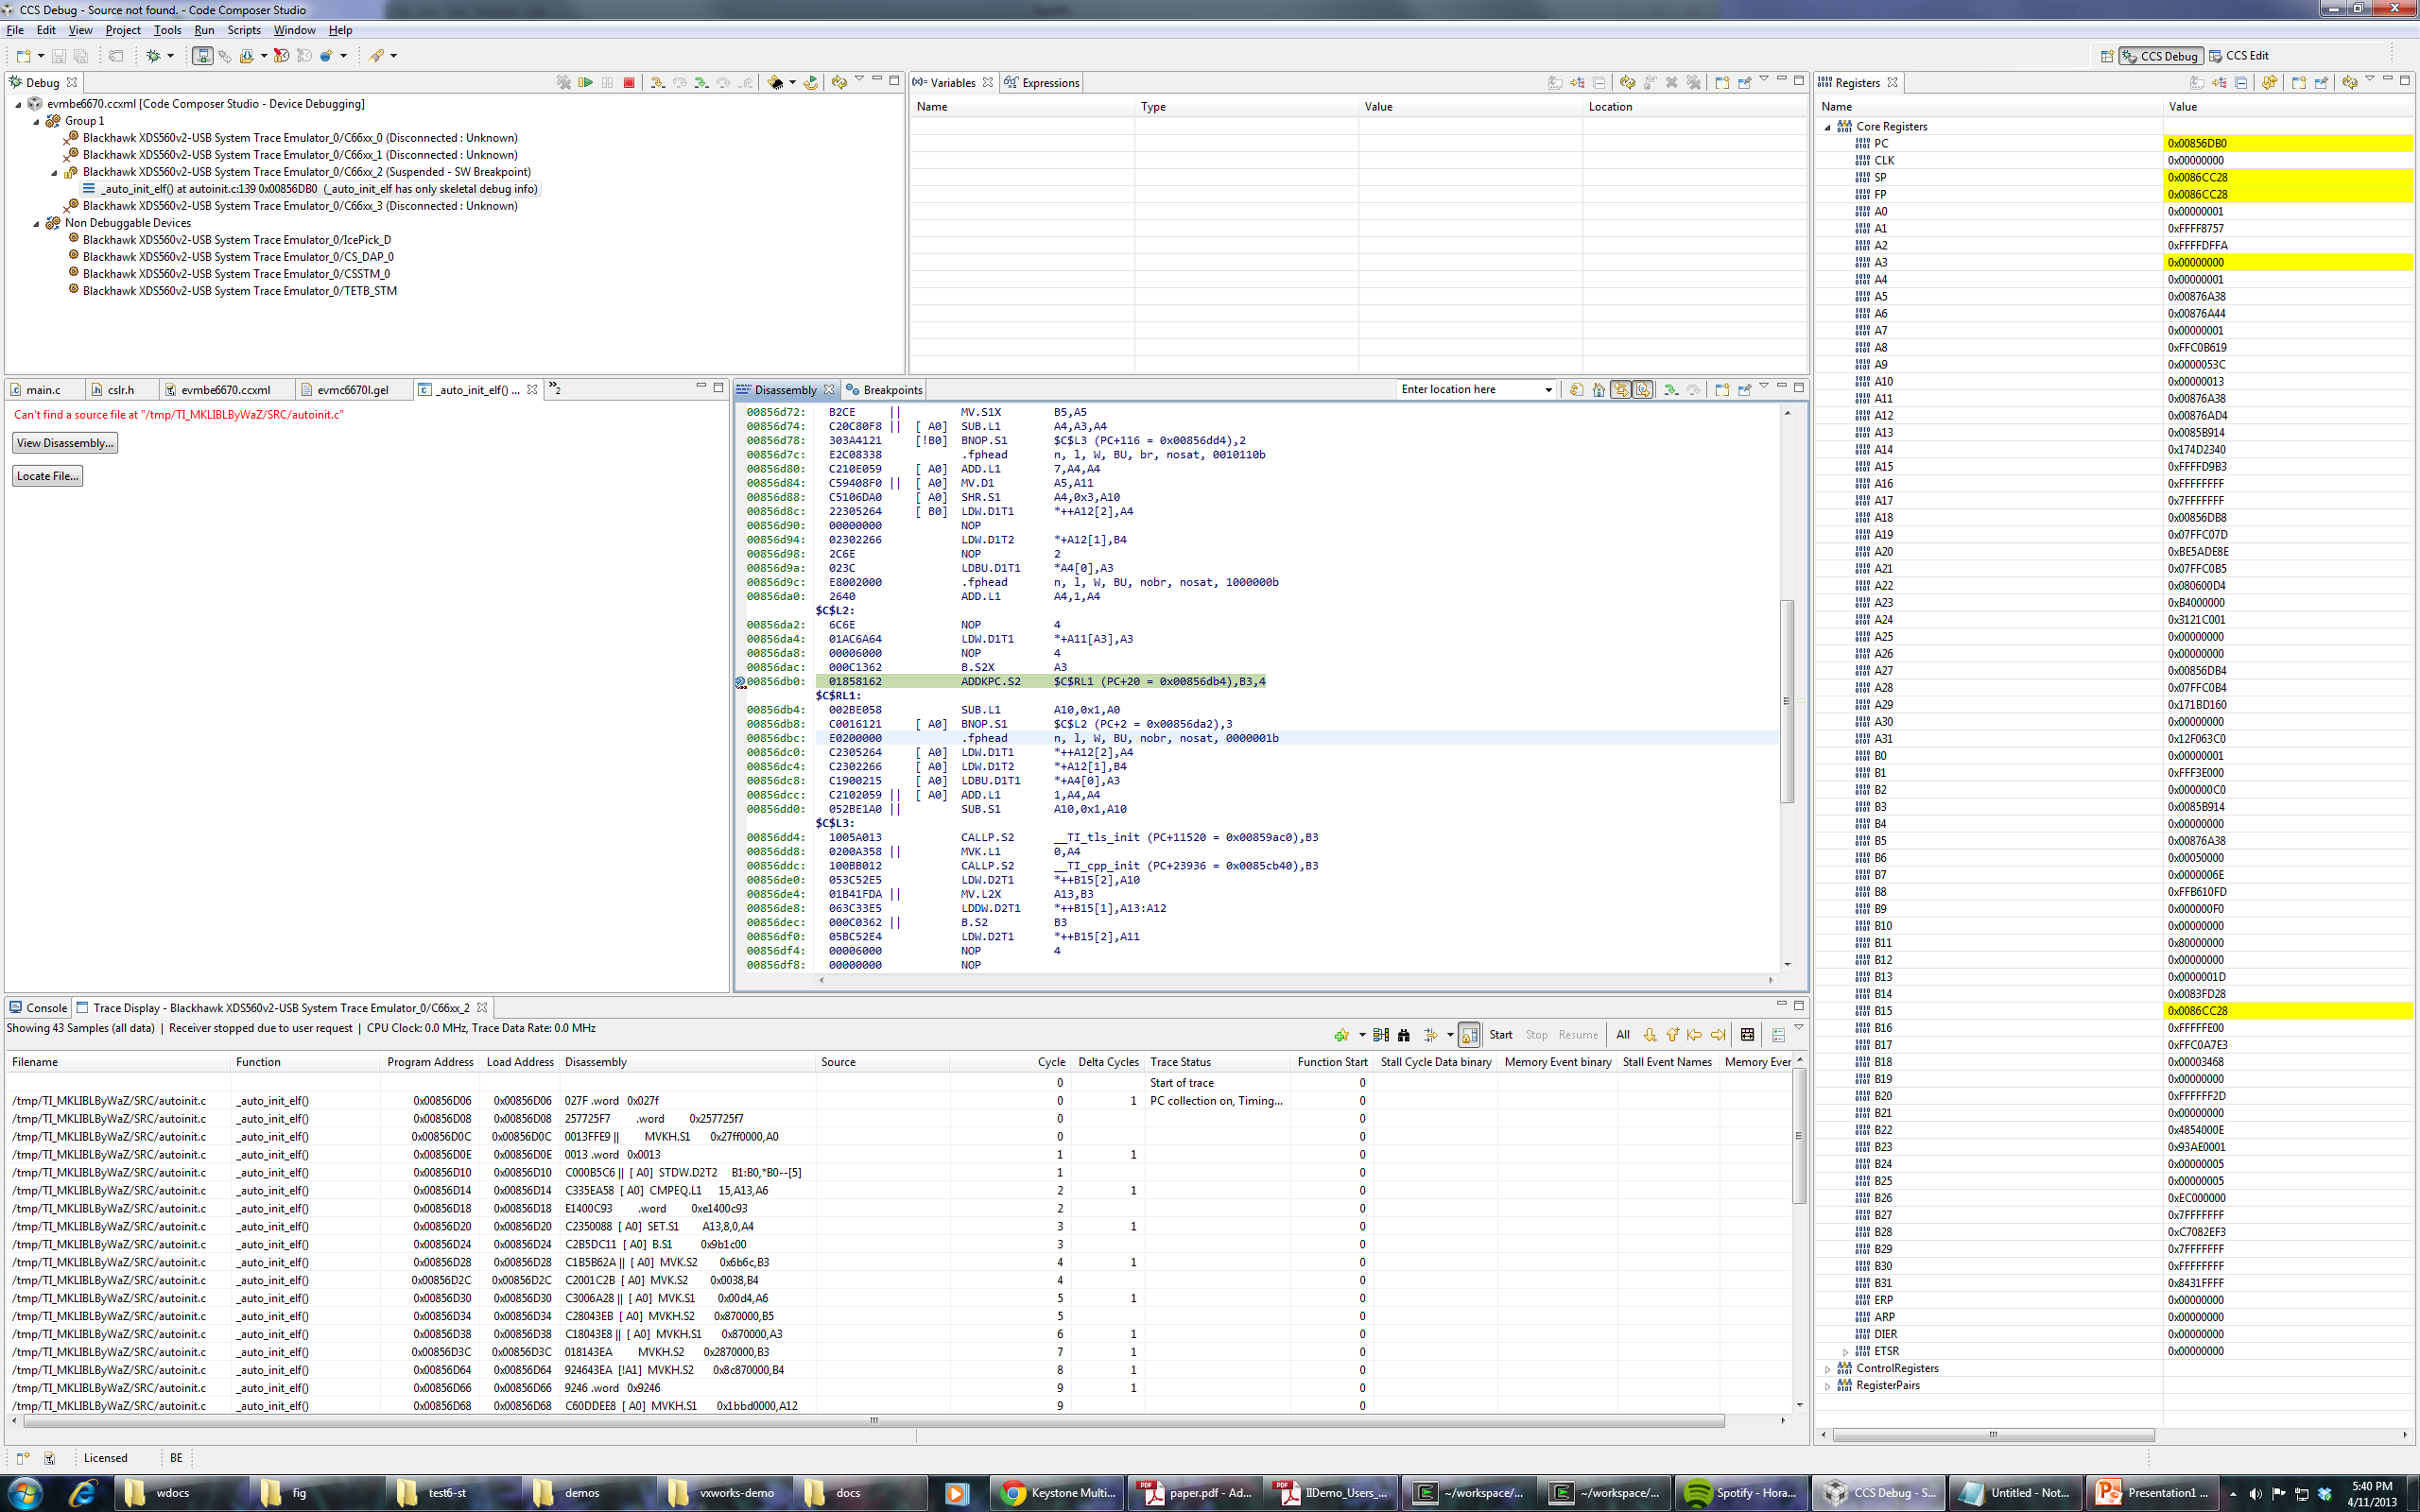
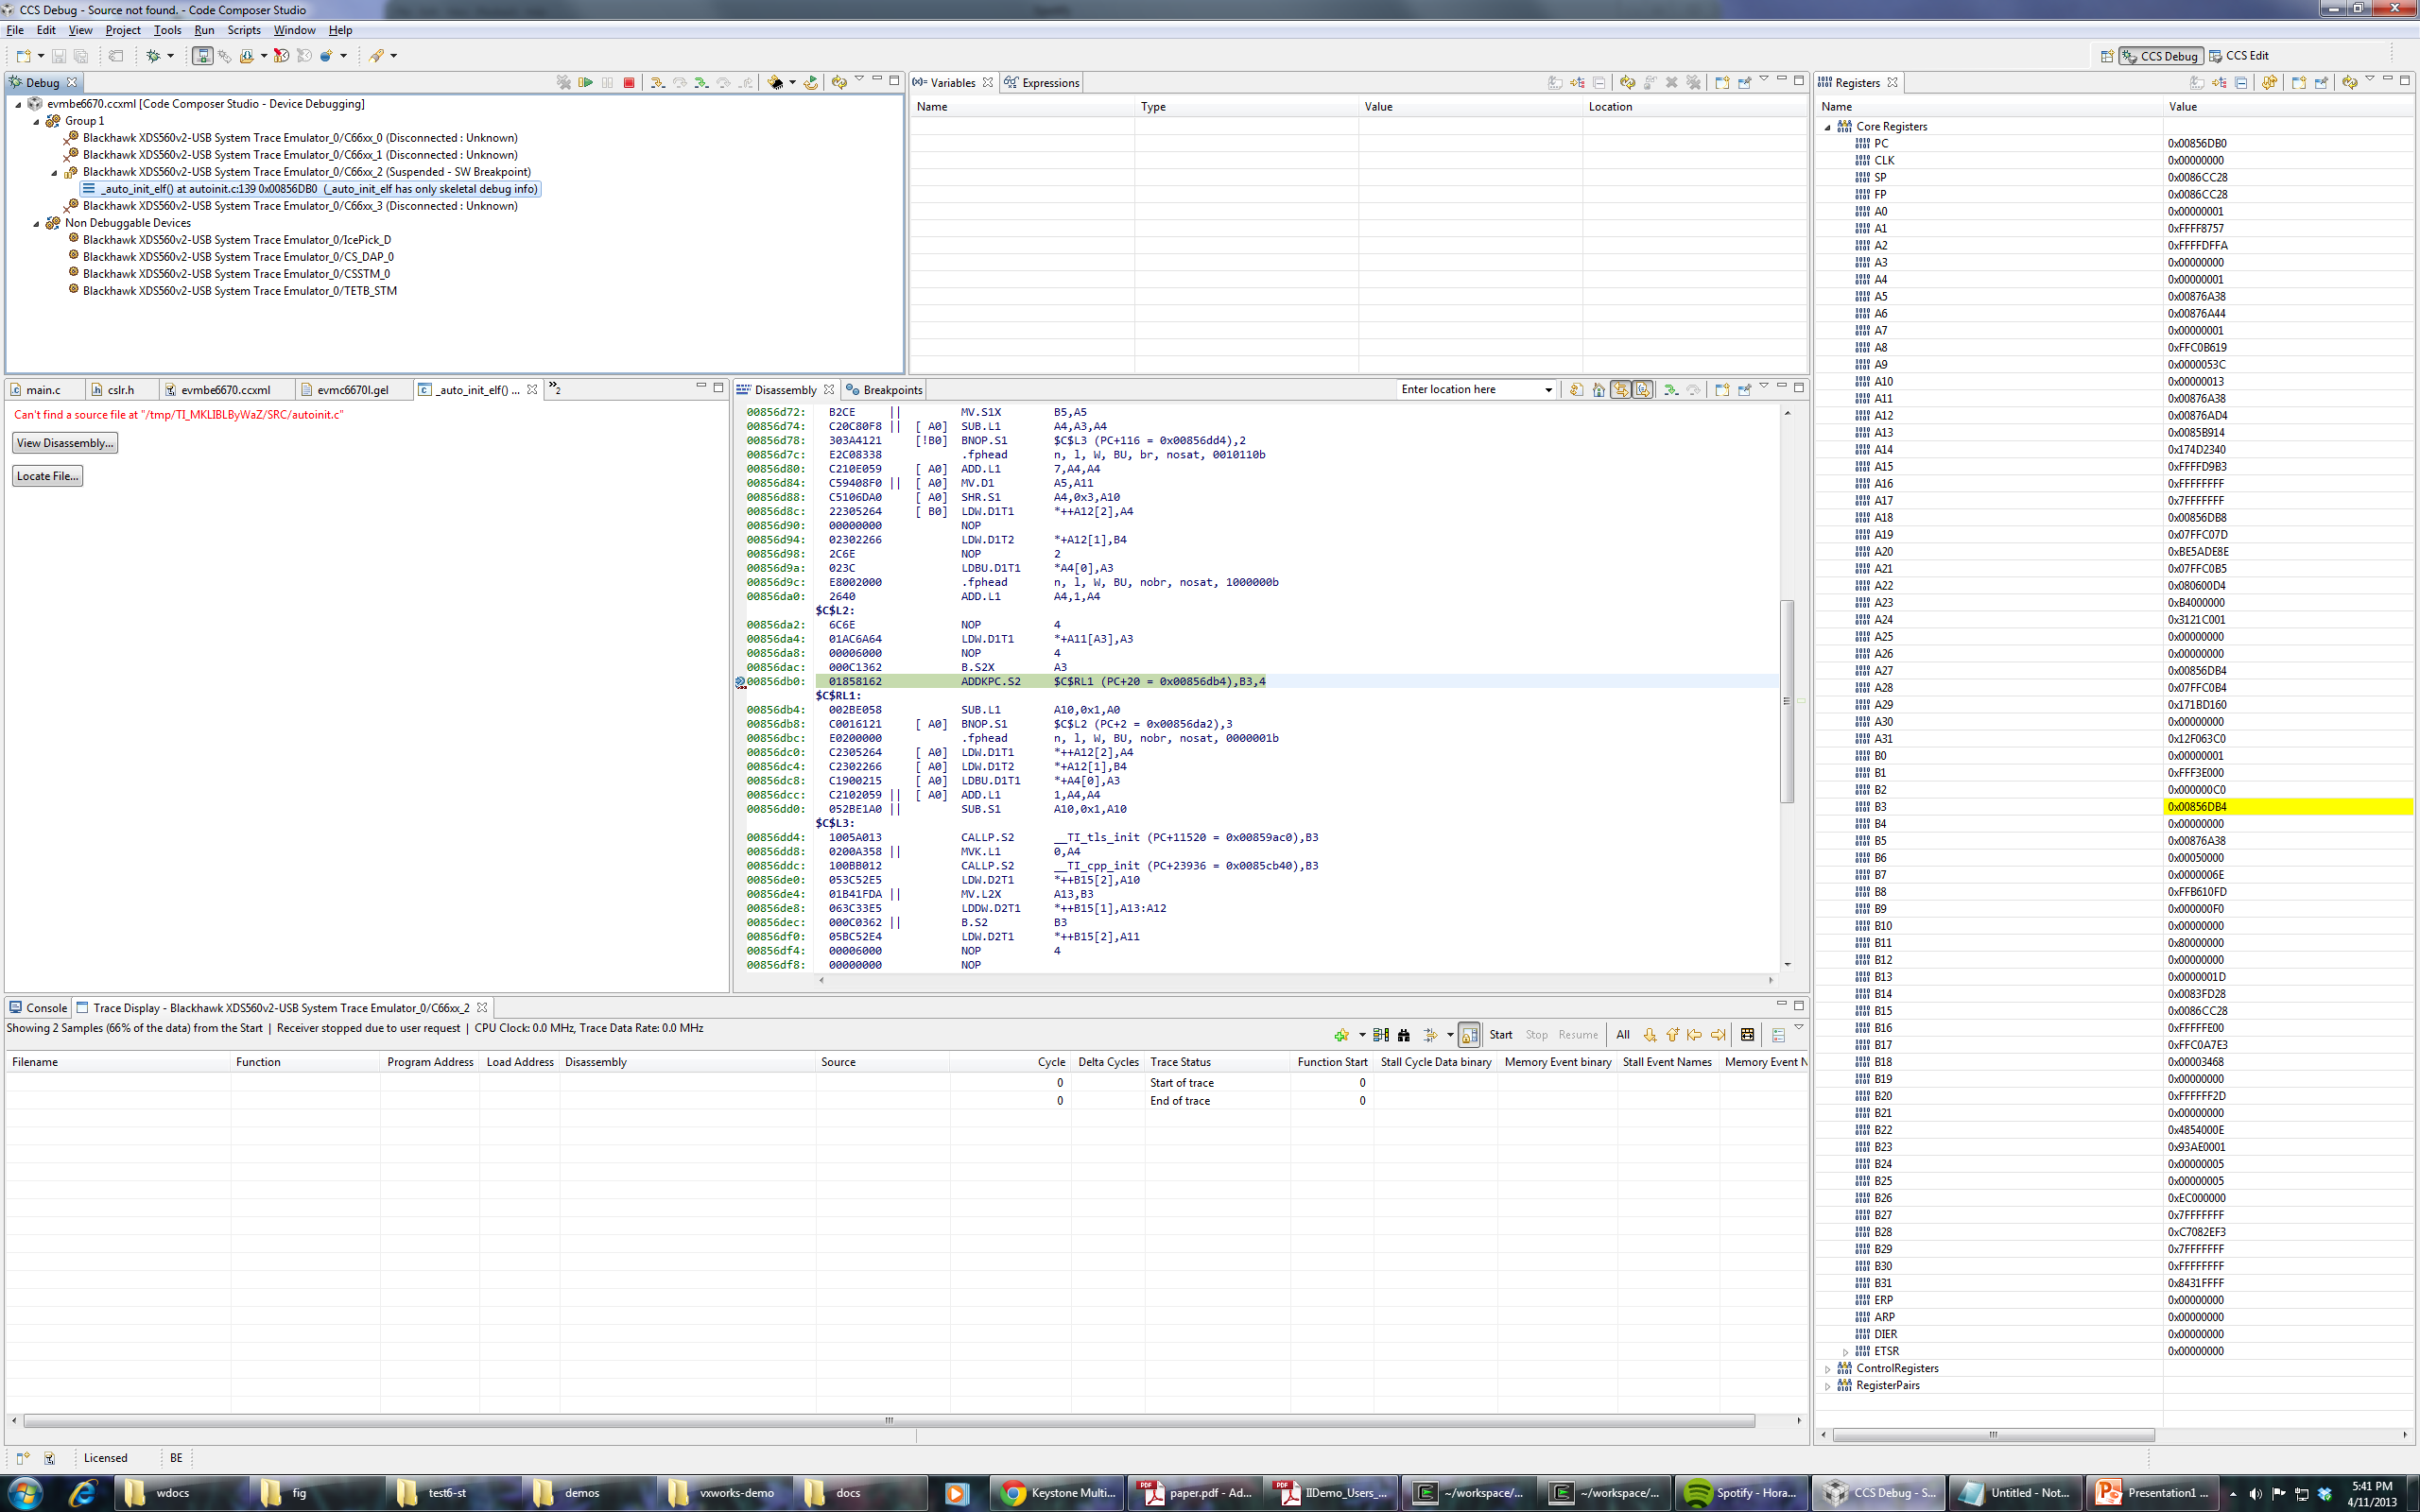
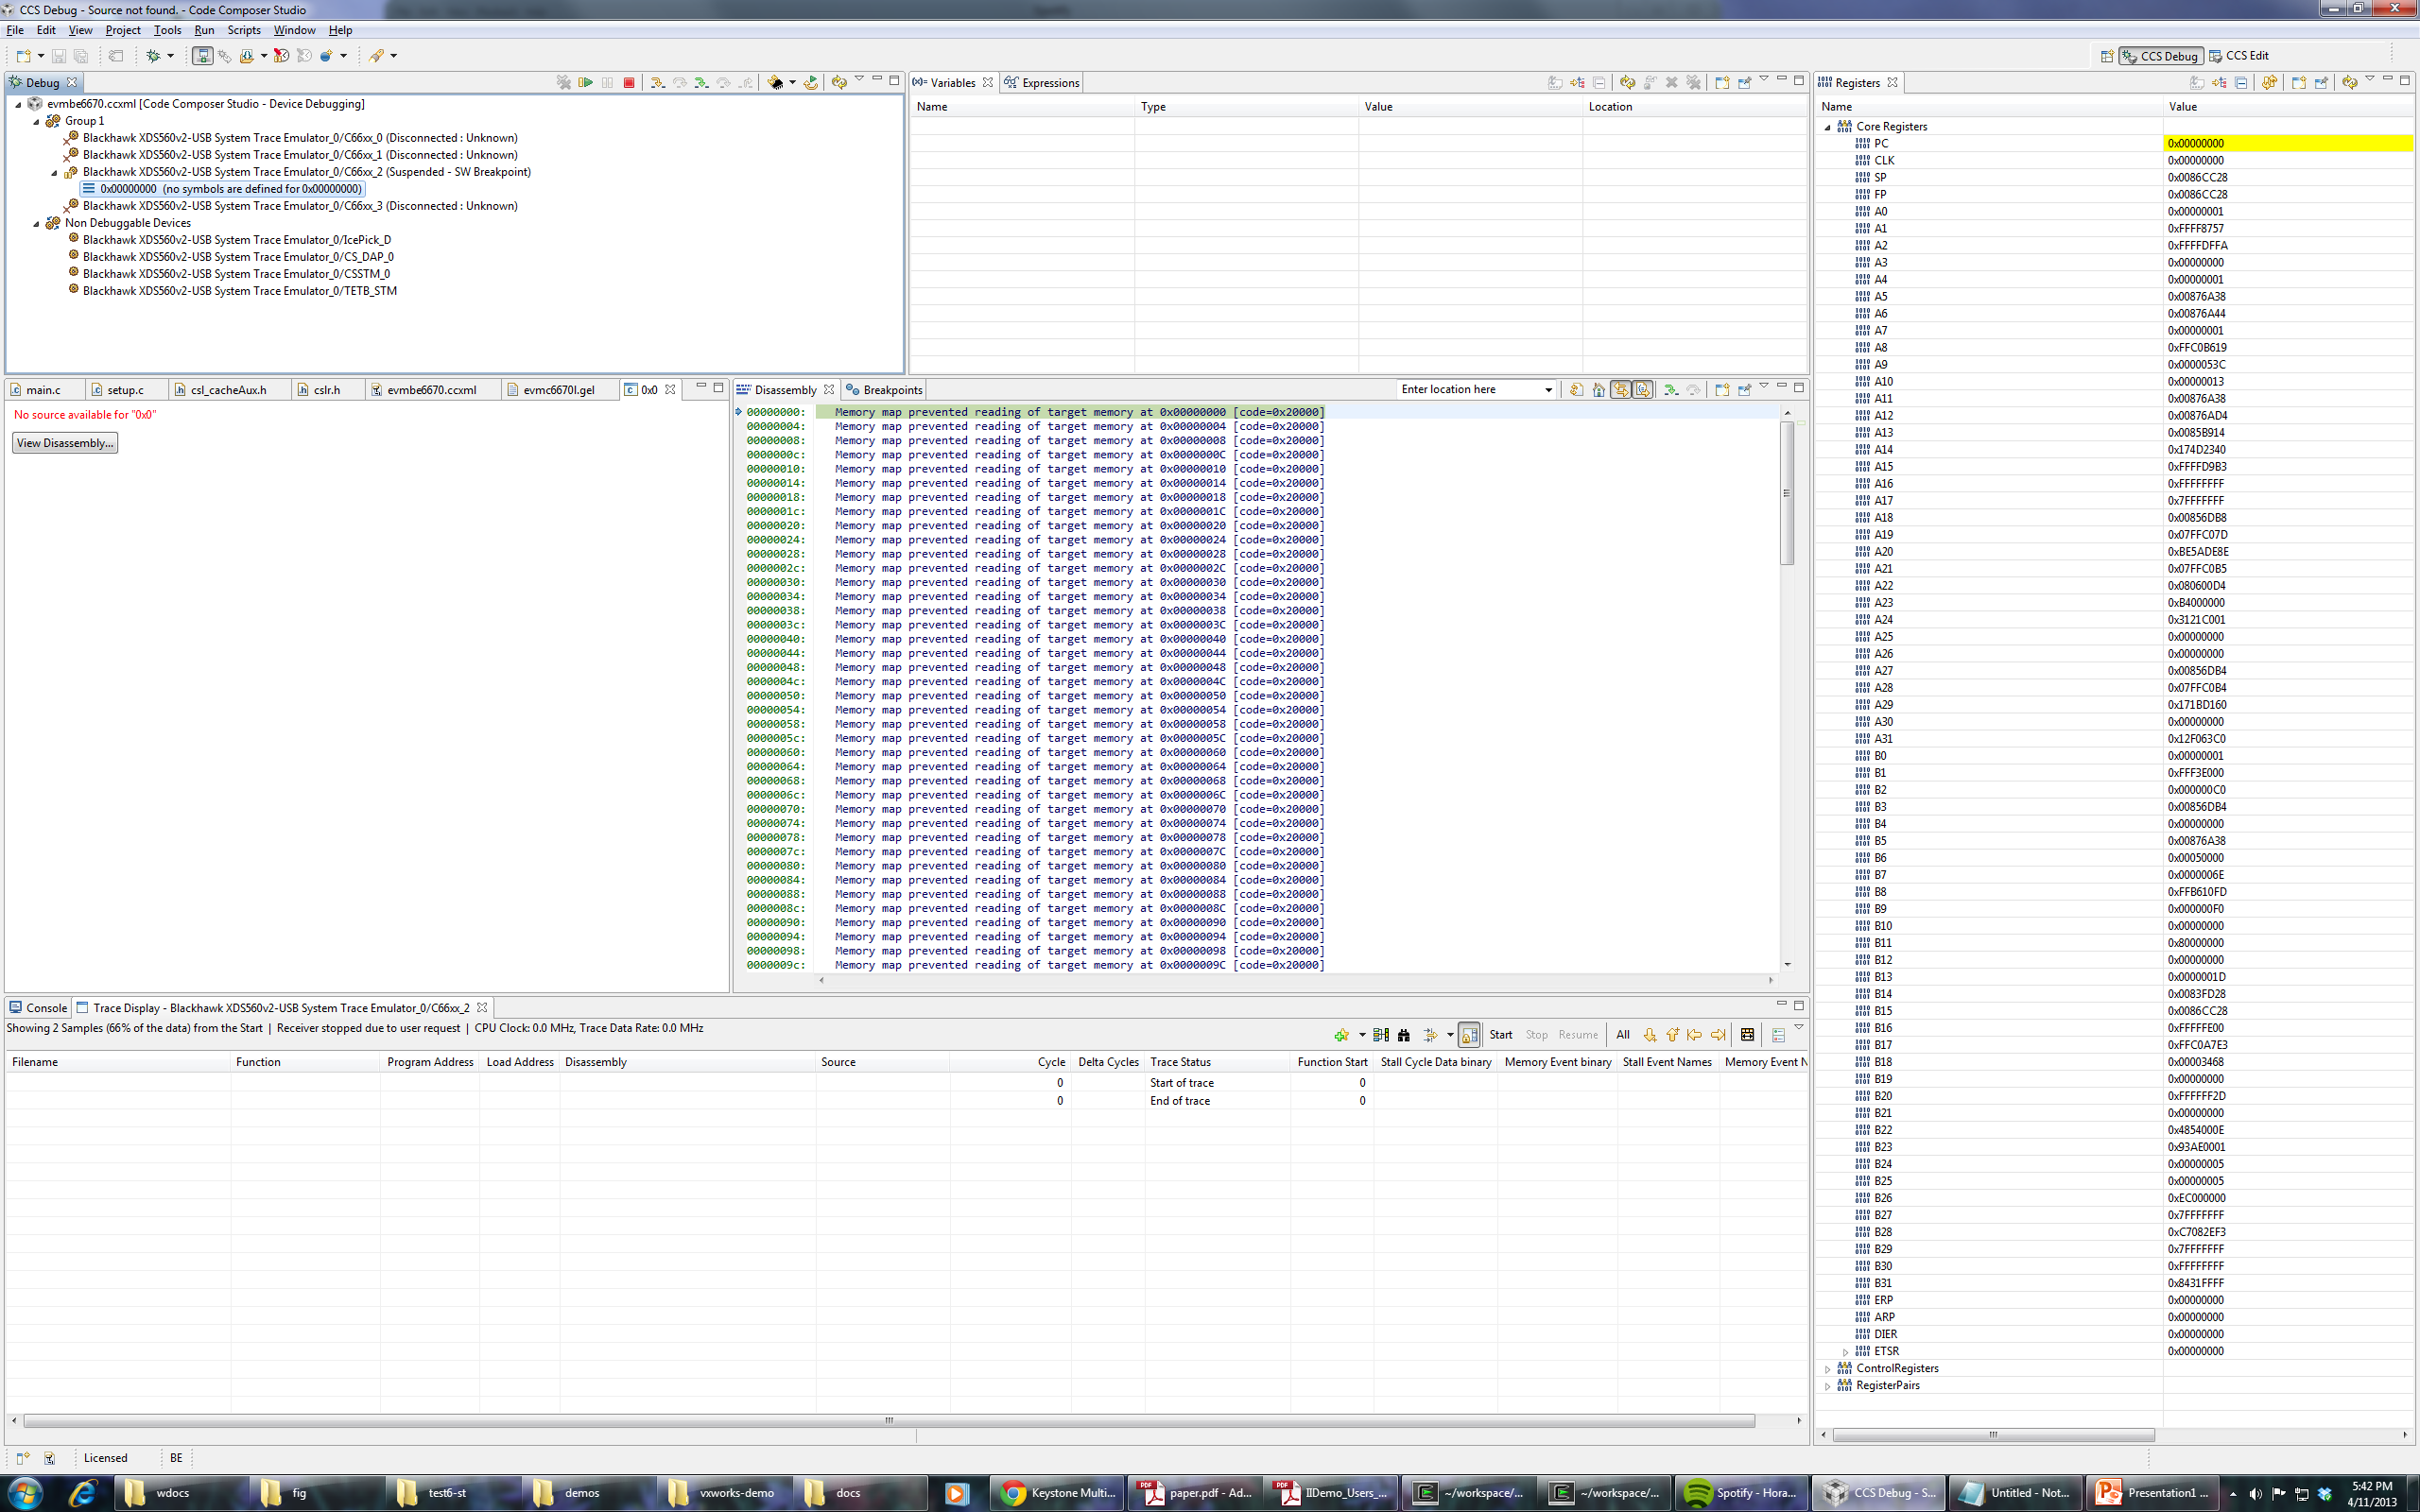
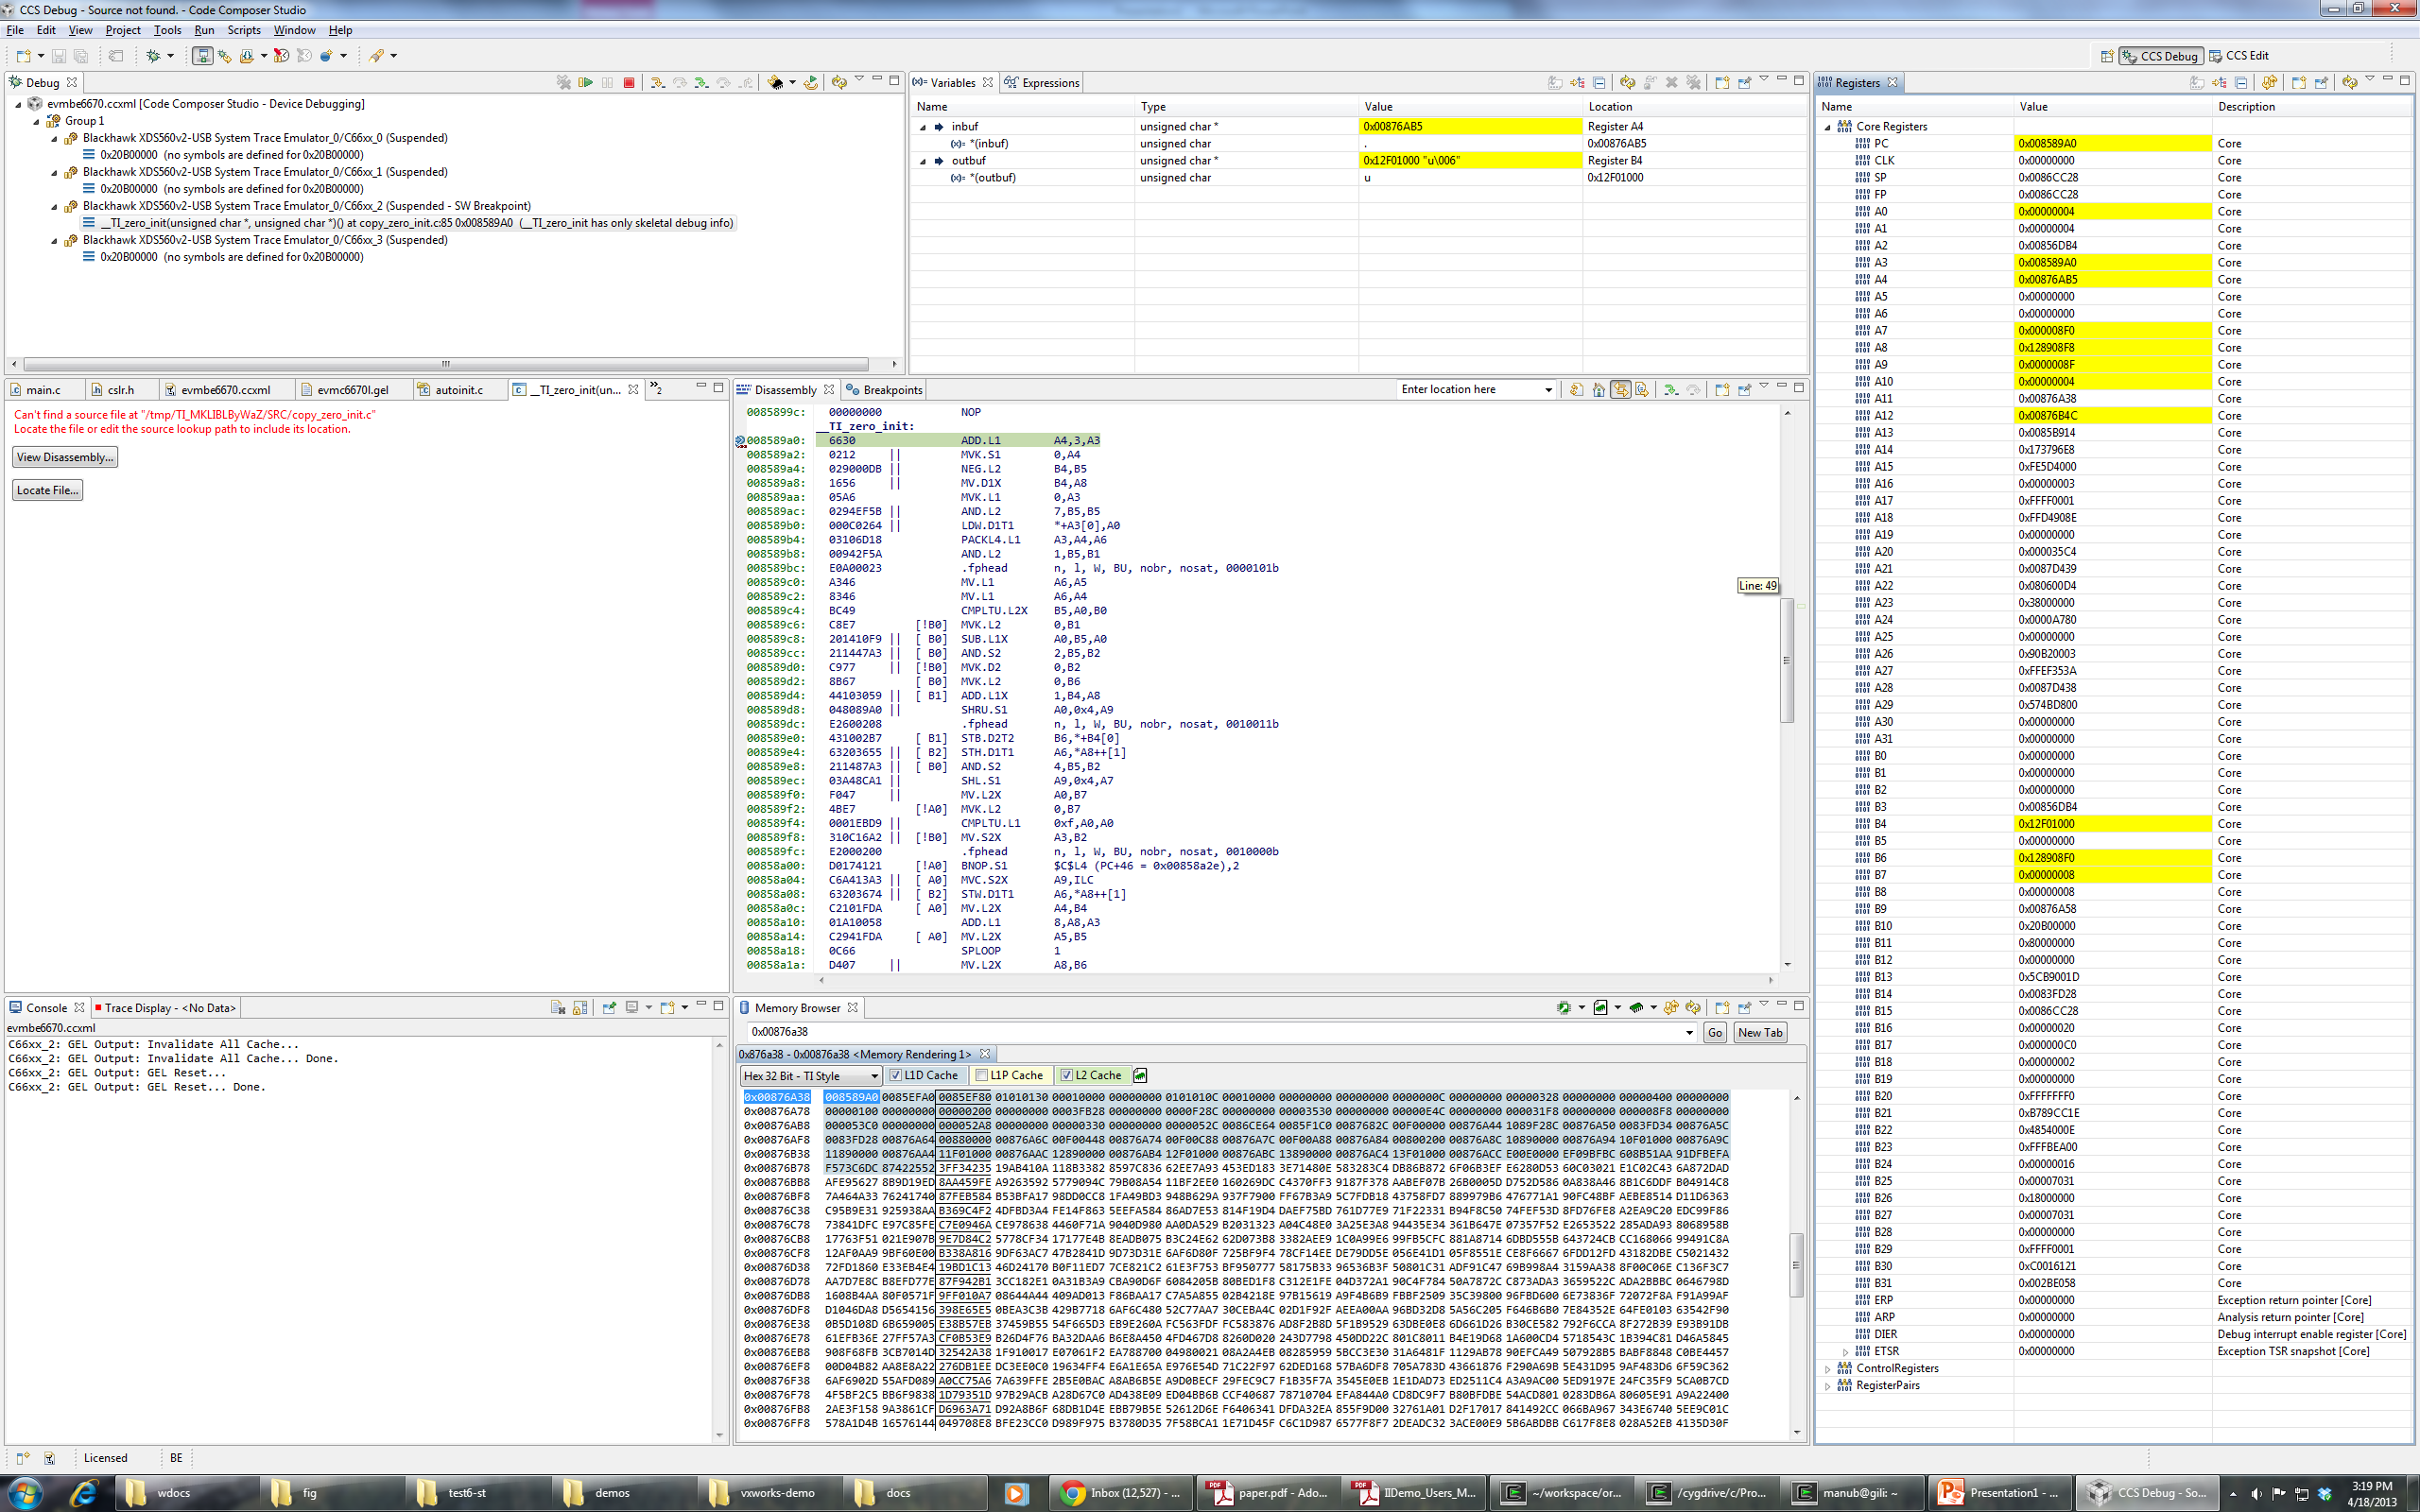
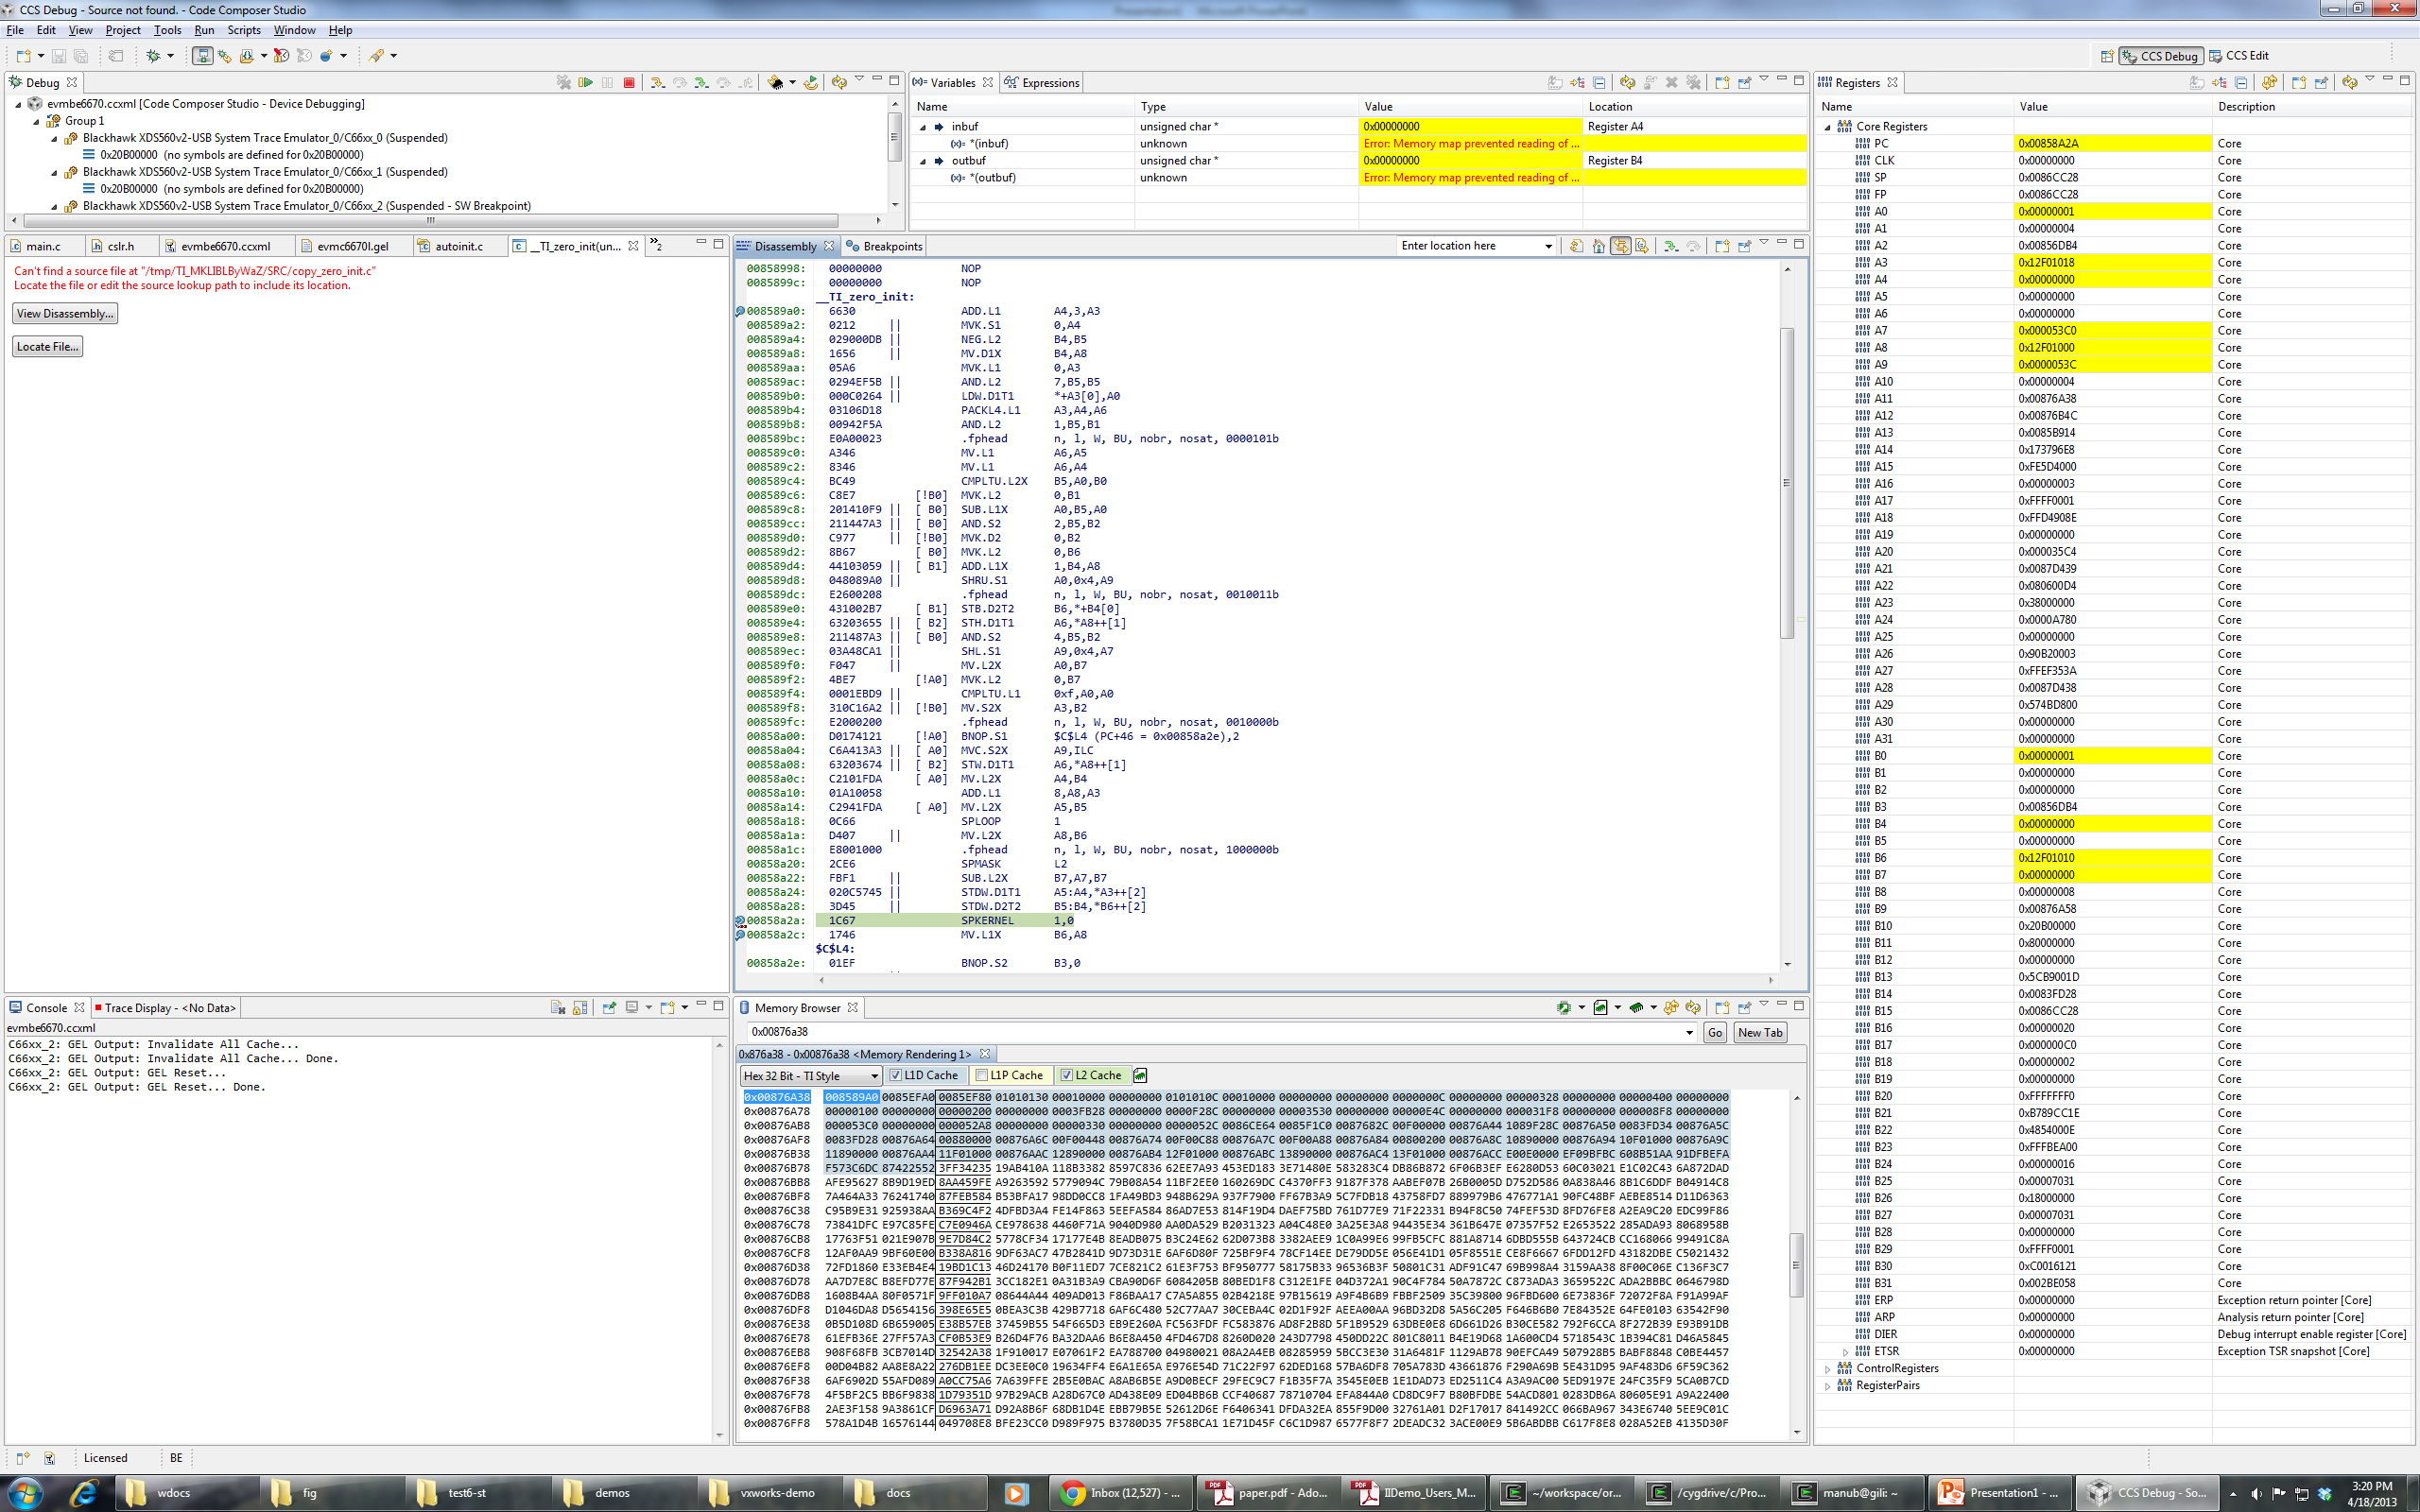
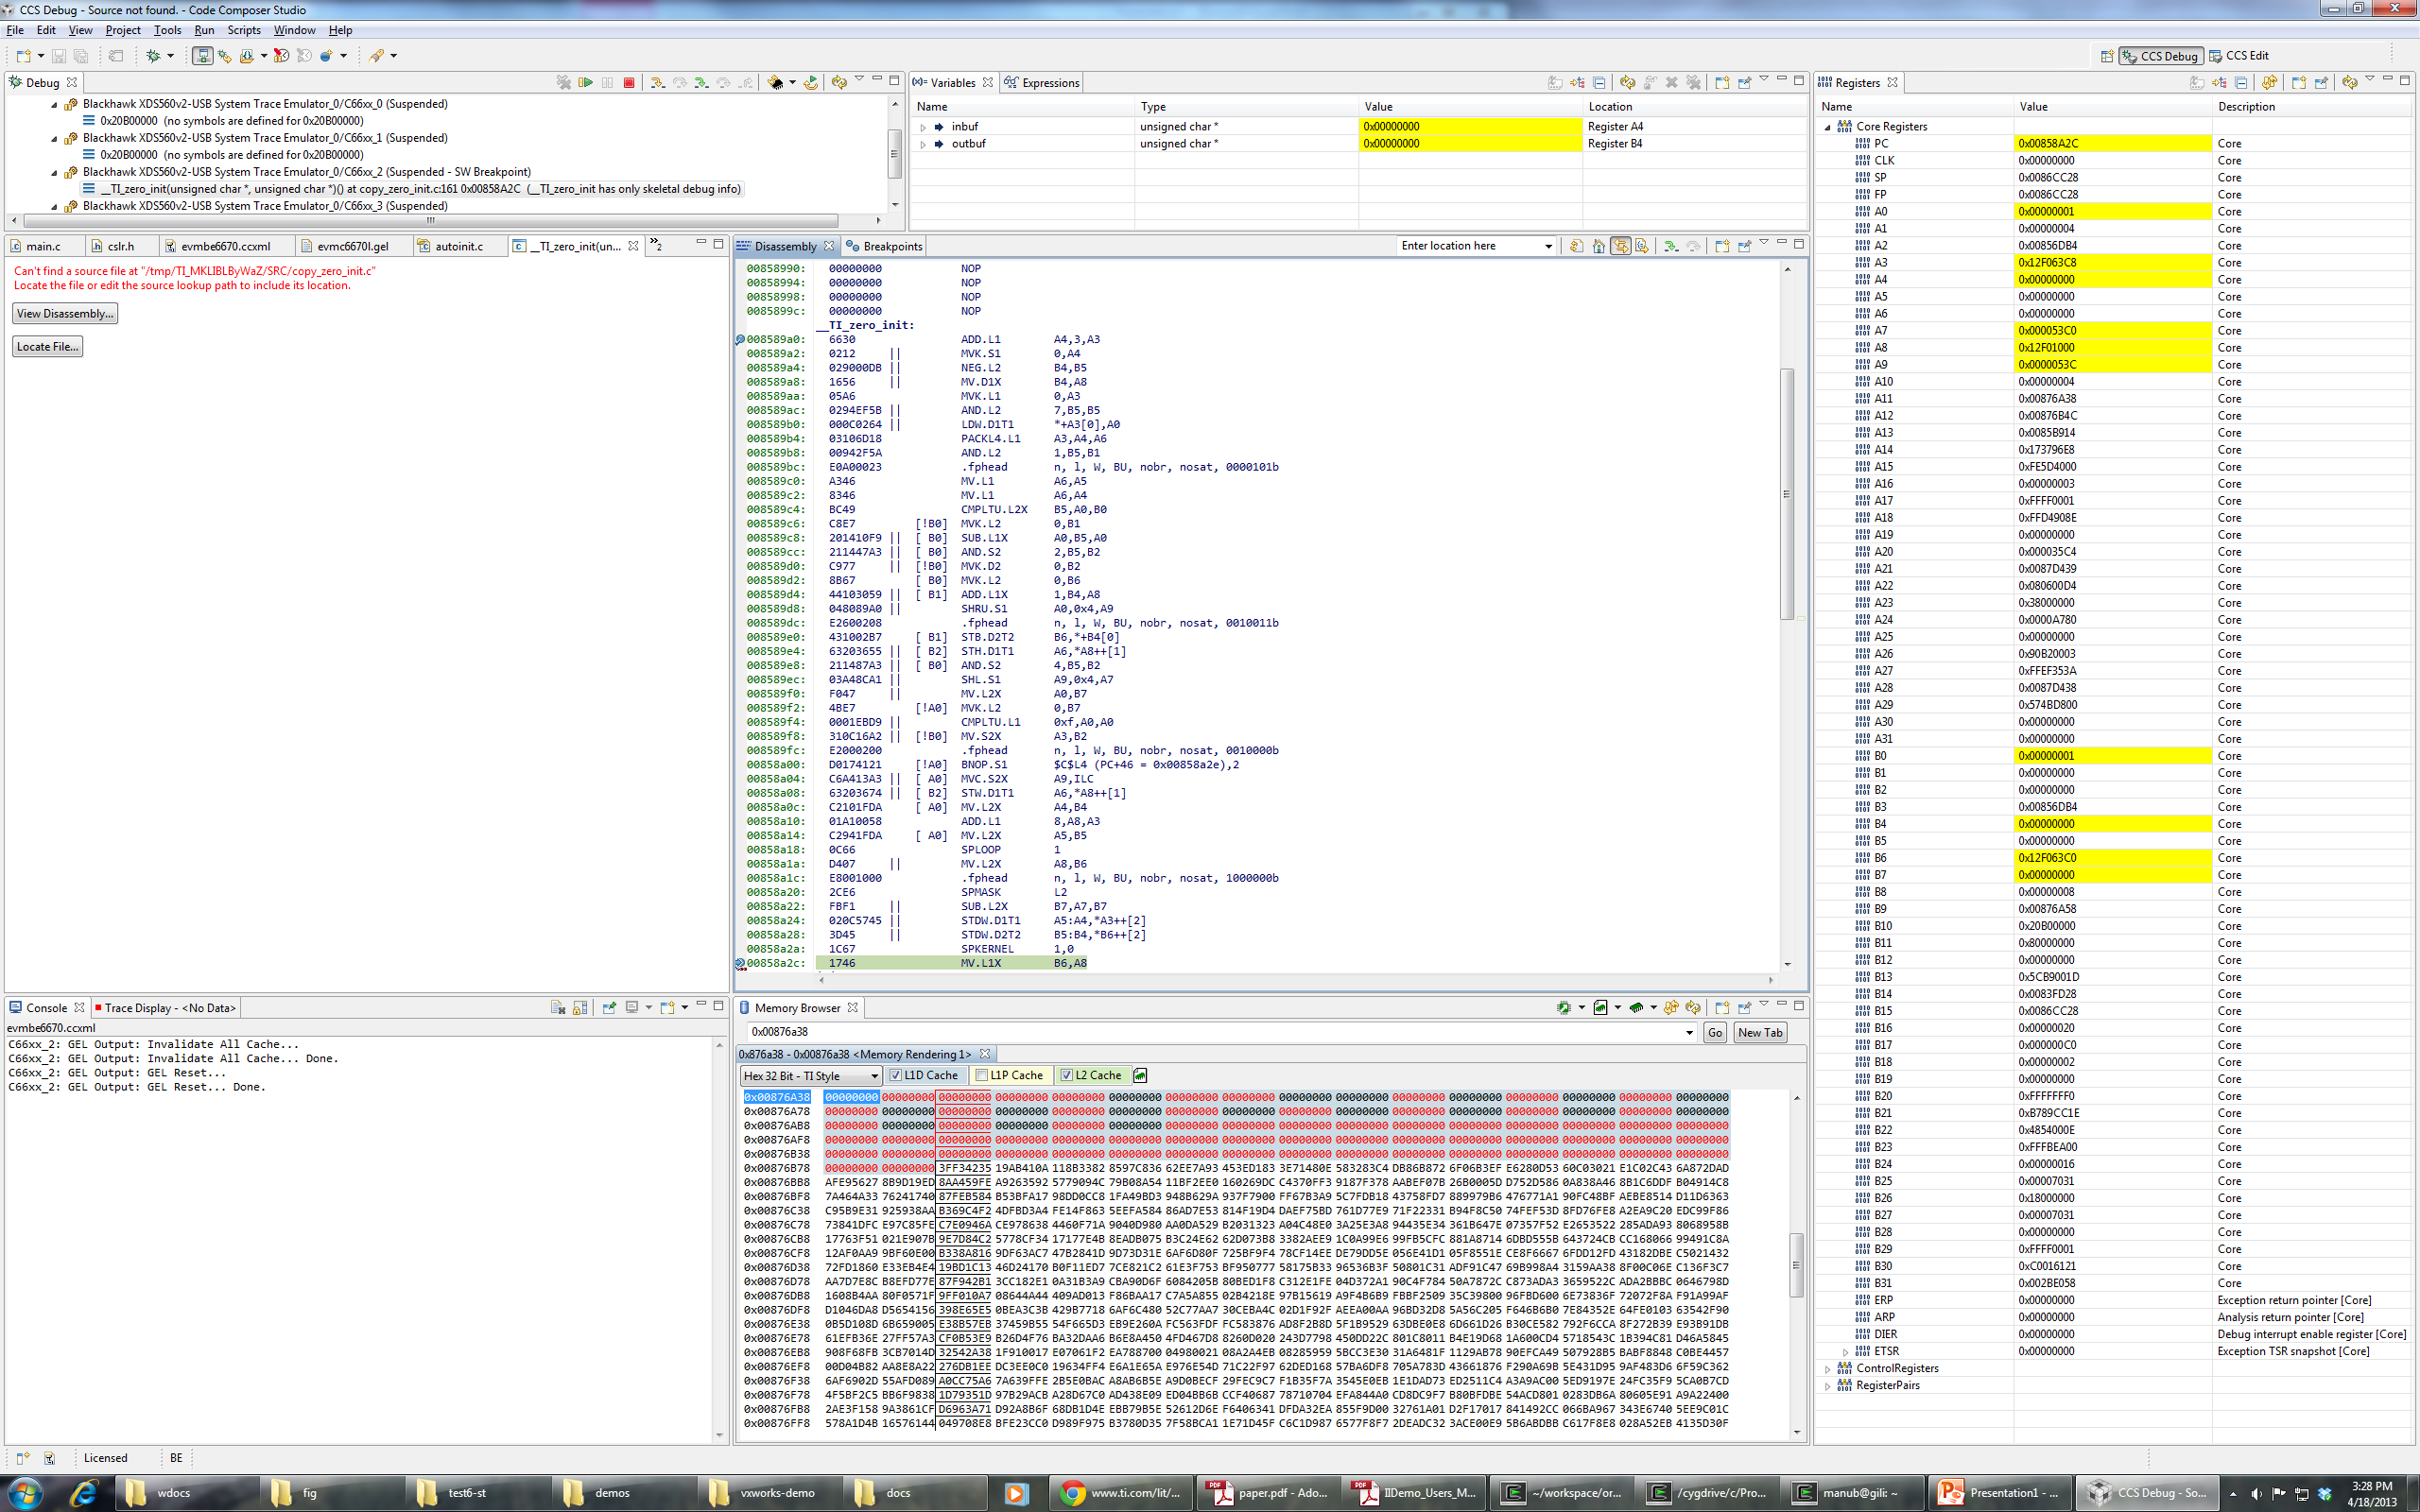
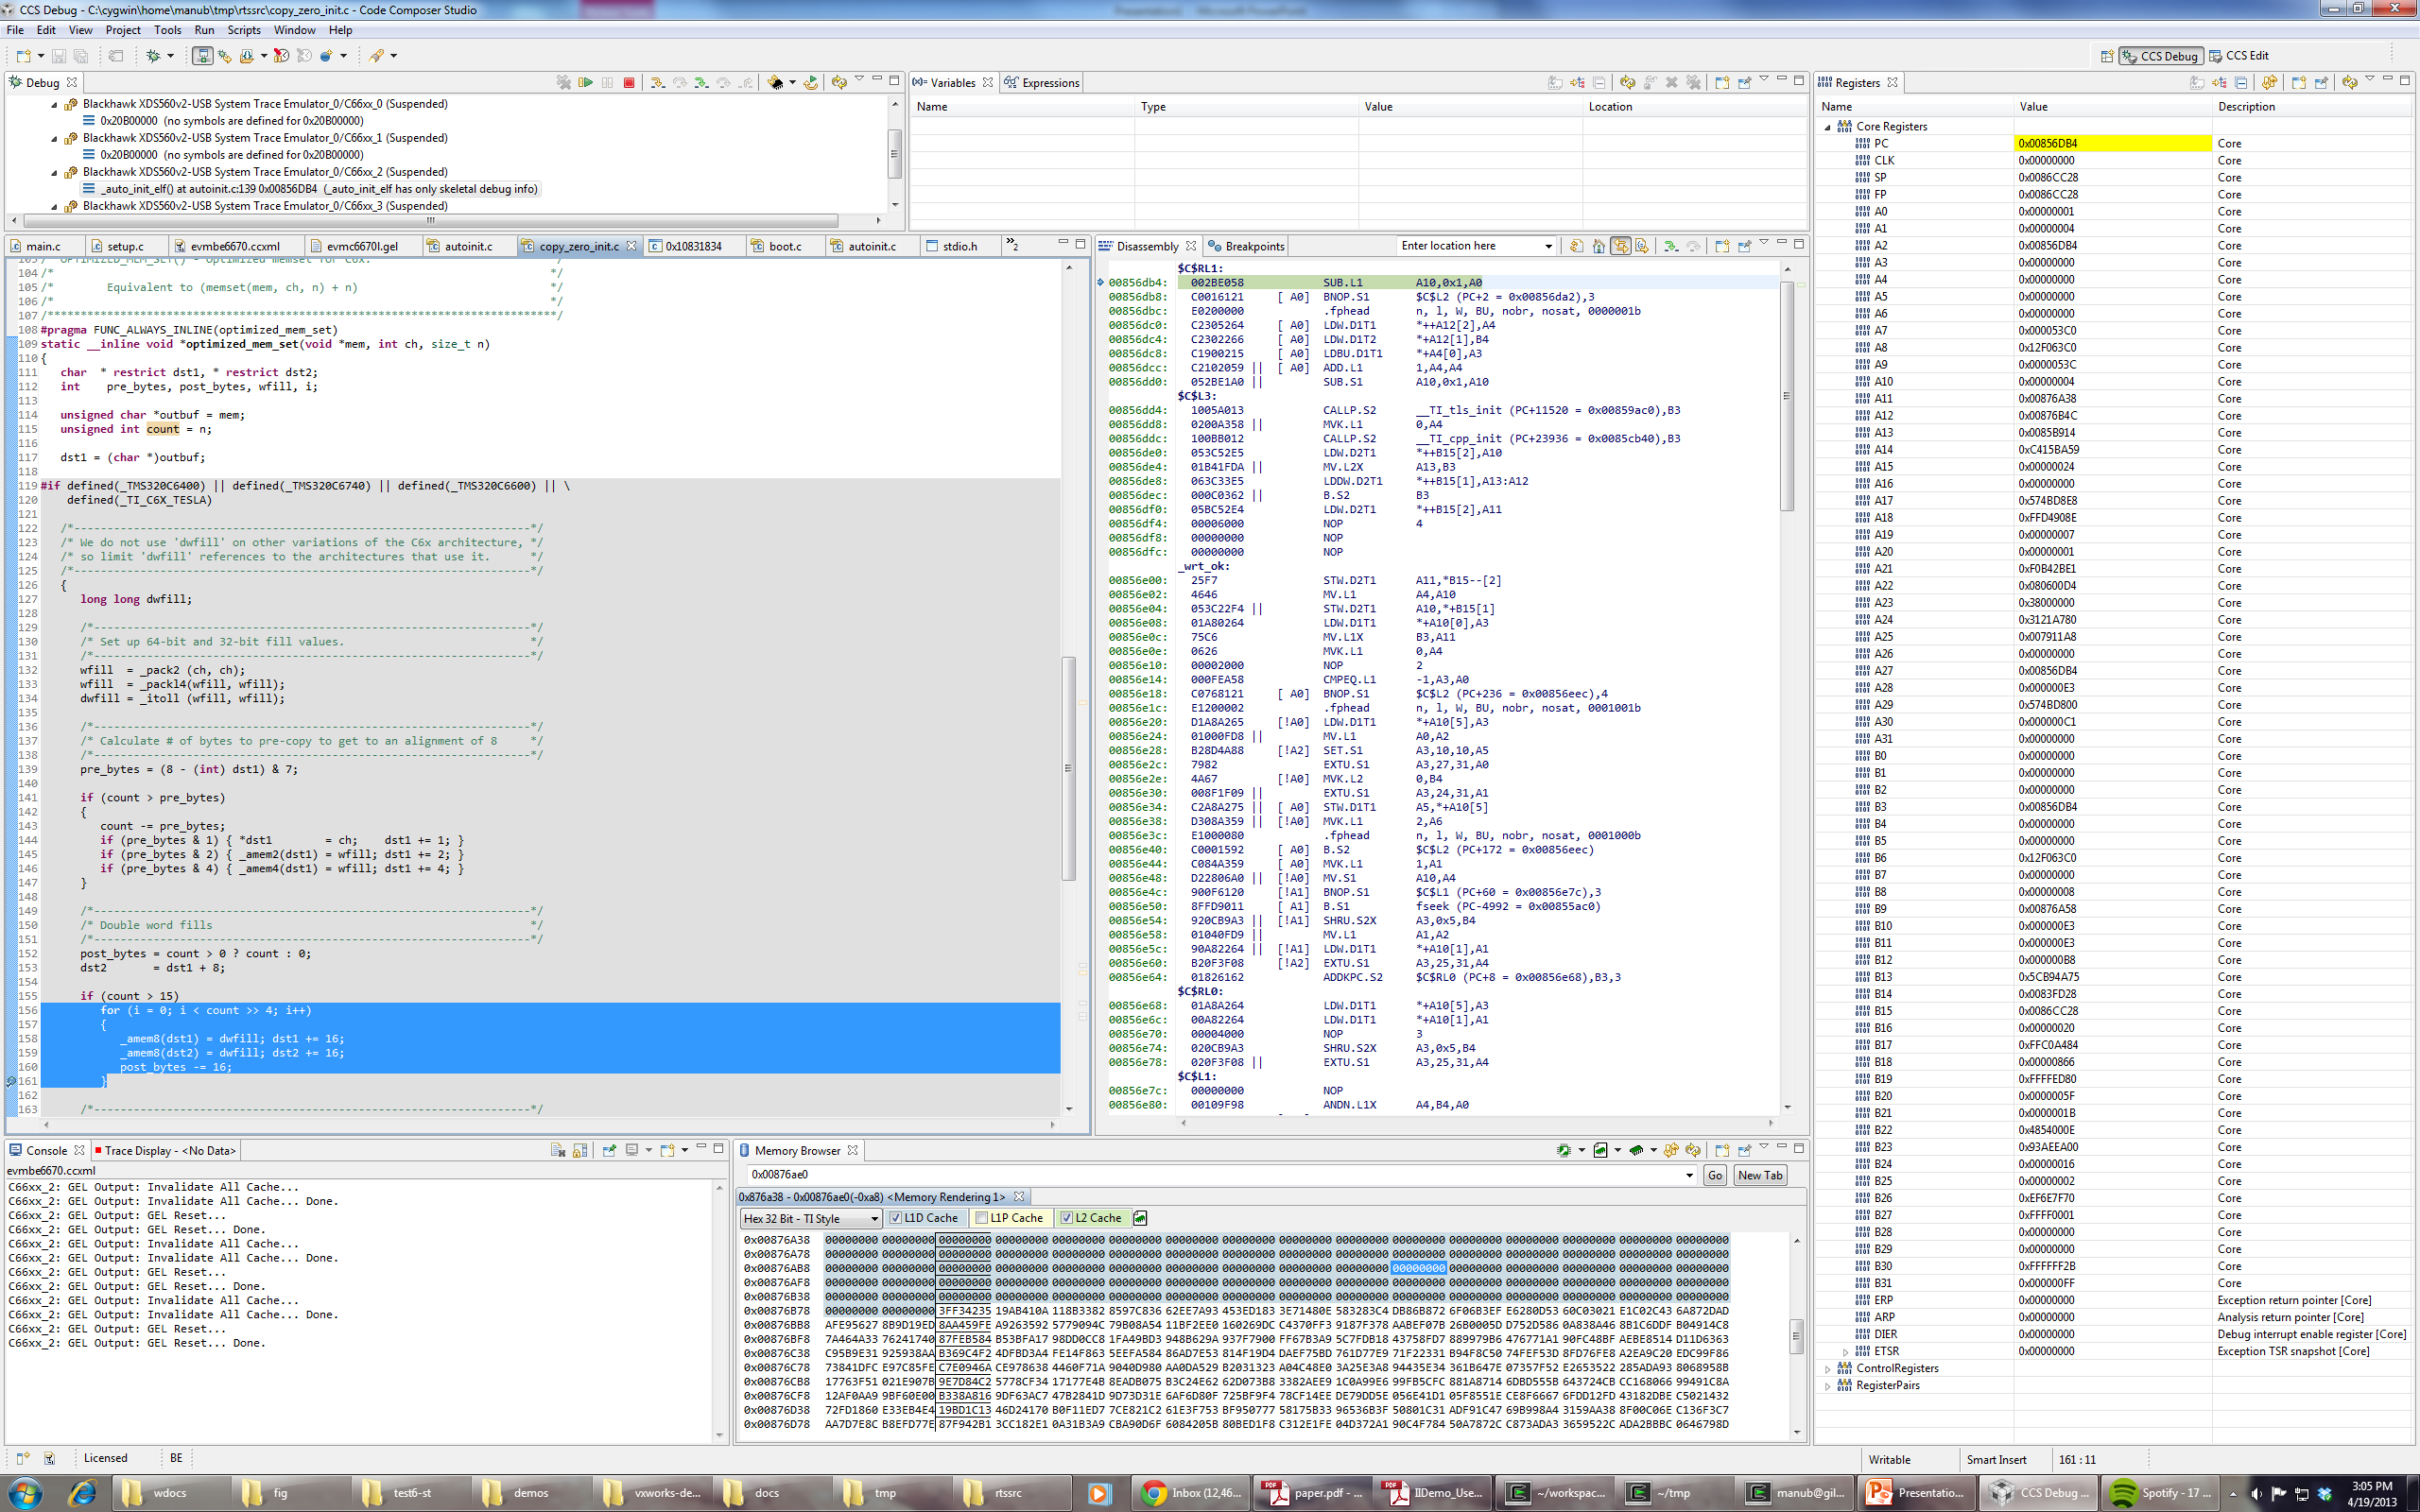
I'm trying to load the binary attached with this post on a c6670 target. (Remove everything in the extension after .out). Program load always goes into weeds on core 2, though it loads perfectly fine (breaks on main) on cores 0, 1 and 3. I tried loading without run to main, and it still goes into weeds on core 2. Any suggestions on how to debug this or what might be the problem?

Thanks.

3681.app_wifirx54mc.zip
  • EDIT: Deleted my previous info as I just re-read the title.

    Are you saying that it's failing to load the code?  Or are you saying the execution of the code once loaded goes off into the weeds?

    Best Regards,
    Chad

  • Hi Manu,

    Just by having the .out file will not help us solve this issue. Can you tell whether  you are defining any function as reset function in the .cfg file using the XDC package? If so, this function will be called during boot time before the main() in called. And I believe Core2 is getting stuck in doing some execution the boot time, hence never reaches the main().

    Regards

    Sud

  • Chad: My code fails to load. It goes into weeds when I load the program and therefore continues to run without ever reaching the main symbol. On one such behavior, I paused execution and B3 reads 0xE1A7C0F0, which is a location in a memory-mapped L2 shared MCM that is made non-cacheable. However, I am not allocating any text to that section, only data. So why should B3 hold a data section address?

    I'm appending some content from my linker command file that may be relevant, but I'm not sure if it helps. Please let me know what else should I give you in adding to the out file.

    Thanks.

    ISHARED_NONCACHEABLE:o = 0xE0000000 l = 00100000h /* Made non-cacheable through corresponing software setup, otherwise this memory address range is not mapped to any physical memory. */

    ISHAREDMCM:          o = 0x0C100000   l = 00100000h

     .sysmem      :>    ISHARED_NONCACHEABLE, START(_start_heap), SIZE(_size_heap)

    .cppi :> ISHARED
    .qmss :> ISHARED
    .ramtst :> ISHARED, START(_start_ramtst), SIZE(_size_ramtst)
    */
    .cppi :> ISHARED_NONCACHEABLE
    .qmss :> ISHARED_NONCACHEABLE
    .ramtst :> ISHARED_NONCACHEABLE, START(_start_ramtst), SIZE(_size_ramtst)

    .hypermcm :> ISHAREDMCM, START(_start_hypermcm), SIZE(_size_hypermcm)

      .shared_mem_noncacheable   :> ISHARED_NONCACHEABLE 

  • Hi Sud,

    I'm not using SYS/BIOS or XDC, so I don't have any .cfg files. It's just the default linker-created init functions that are executing before reaching main. One of those must be causing problems. How do I find out which and why?

    Thanks.

  • Are you bootloading the code or loading it via JTAG.  The comment about failing to load the code is not consistent w/ stating that you run the code and it goes off in the weeds. 

    Also, have you tried loading this in the Simulator and see how it reacts.

    Also, that address space "ISHARED_NONCACHEABLE:o = 0xE0000000 l = 00100000h " is a fair way out into the DDR space, are you sure you have DDR memory at that location?  If this is on our EVM, then I'm fairly certain there's no memory there as it has 512MB of DDR3 starting at 0x8000 0000 (so that would end at 0x9FFF FFFF)

    If you're using JTAG (loading via CCS window) I would guess that it's not loading and you get an error message about not being able to load to space.  This would not be running the code, as it failed to load the code.

    The more details you can provide as to how your attempting to load the code and what if any error messages you are receiving, and how much DDR3 you have on the board will help us diagnose what you are observing.

    Best Regards,

    Chad

  • Chad,

    I'm loading the code over JTAG via CCS. I think "load fails" is causing confusion. It is not failing in the strict sense of CCS reporting that load failed. Code does load, but then the initialization execution that automatically happens upon load in CCS is when the code goes into weeds. I think that phase corresponds to zero initialization and such things. What I call a successful load is when the program loads, runs up to main symbol and then the core waits in the debug-break state, ready to resume execution. In this particular scenario, it never reaches that debug-break state on the main symbol and shows as "running/resume mode" forever.

    This is an Advantech 6670LE EVM. You are right, there is no DDR at 0xE0000000. I am mapping the shared memory to that address range and setting the non-cacheable flag on it, both through software. This is so that I can use the shared memory as an L2 SRAM that stays coherent across cores since it is never cached in any L1. I am not using the DDR at all. This setup has been working fine for a long time. I don't think there is any issue there. I just mentioned it because B3 seemed to have an address from that range.

    Manu

  • I guess the first thing is with CCS.  I don't like using the 'Go to Main upon loading code, option'  I prefer to have it do nothing upon loading (i.e. the PC is set to the Entry pointer and doesn't start running.)  That's what I consider a successful load (i.e. code has loaded, data verified by CCS has it's loaded, and nothing else.)

    Then I can either do a go main from the menu or put a breakpoints at main and run to it, or I can start stepping through my code if I think something is wrong.

    That said, have you looked at the code that's at/around B3 does the code look valid?  Also, what about the code that's at PC when you halted does it look valid?  Does it look like you're in some sort of infinite loop.

    Have you attempted to run the code in the Simulator?

    I'm not sure exactly what you're code is doing.

  • Okay, so I turned off run-to-main and then stepped through the code till it went into weeds. (I was hoping there would be better way than to step through, but anyway). After load, we are at _c_init00() at boot.c  0x0085B8E0. The next function to be called is _auto_init_elf(), which is the one that faults. I'm attaching three screen shots with disassembly and core register contents (PC, B3 and others) around the instruction that causes problems:

    00856db0:   01858162            ADDKPC.S2     $C$RL1 (PC+20 = 0x00856db4),B3,4

    As the screenshots show, after this instruction, PC gets set to 0x0000000.

    It is not one of my functions. This is compiler generated function. Could it be misbehaving because of some memory corruption caused by either earlier instructions in the same function or in _c_init00?

    ------

    On the functional simulator for 6670, the code runs to main on all cores and then breaks and waits for resume. On core 2 (the one faulting on silicon), after the particular instruction at 00856db0, PC gets set to 0x0085EFA0, which is __TI_decompress_rle24. I do, however, get the following warnings (shown only for core 2) in the run up to main:

    TMS320C66x_2: Warning: CGEM0_5: Memory Write not supported at address since memory configured as cache f00000 CGEM0_5: Memory Write not supported at address since memory configured as cache f00001 CGEM0_5: Memory Write not supported at address since memory configured as cache f00002 CGEM0_5: Memory Write not supported at address since memory configured as cache f00003 CGEM0_5: Memory Write not supported at address since memory configured as cache f00004 CGEM0_5: Memory Write not supported at address since memory configured as cache f00005 CGEM0_5: Memory Write not supported at address since memory configured as cache f00006 CGEM0_5: Memory Write not supported at address since memory configured as cache f00007 CGEM0_5: Memory Write not supported at address since memory configured as cache f00008 CGEM0_5: Memory Write not supported at address since memory configured as cache f00009 CGEM0_5: Memory Write not supported at address since memory configured as cache f0000a

    I am allocating data, including some const and some non-const globals, to L1DSRAM, which is what 0x0f000000 range is. However, I'm using the default GEL configuration which sets it as all cache, and then only setting L1D as SRAM in a setup function called from main. So at the time of auto initialization, that part of memory is still set as cache, which is what is probably throwing these warnings. Could that be the problem? If so, should I be modifying the GEL to match the configuration?

    Thanks,
    Manu


  • Take a look at the code just before the ADDKPC.  Here's what's there

      LDW  *+A11[A3], A3

      NOP  4

      B       A3

      ADDKPC

    At the point the ADDKPC occured, A3 is already = 0, It was from the load instruction (followed by the NOP4, means that the A3 write landed before the B A3 - Branch to address in A3.)  That's an invalid memory space (nothing is there.)

    You'll want to go back and look were that came from.  Reload put a breakpoint on LDW *+A11[A3], A3.  Now take the value in A11 + 4*A3 (you need the A3 prior to the load, it's used as an offset by A3 words to the value inside A11 at that point.) 

    Now, why did it work on the Simulator and Not on HW.  It most likely has to do with having an uninitialized variable, the simulator will have all memory initialized as 0 upon reset, but real hardware has random date inside it.  So if you used something that was uninitialized prior to initializing it, it's going to be 0 in the simulator, it's going to be some random garbage on HW.

    When you compile you code (do a rebuild all) do you get any warnings?  They should show up for using uninitialized variables.

    Best Regards,

    Chad

  • I went around following registers. A11 points to 0x00876A38, which is the location of  __TI_handler_table, which, according to my memory map output file looks like:

    LINKER GENERATED HANDLER TABLE

    __TI_handler_table @ 00876a38 records: 3, size/record: 4, table size: 12
    index: 0, handler: __TI_zero_init
    index: 1, handler: __TI_decompress_rle24
    index: 2, handler: __TI_decompress_none

    A3 is accordingly 0, 1 or 2, and ends up loading one of these functions. The reason why A3 loads 0x0000000 at one point is because 0x00876A38 memory gets written with zeroes. I narrowed down the part of code that writes that memory with zeroes, and it turns out to be an instruction in __TI_zero_init function. __TI_zero_init is called successively on different input and output buffers. A few of them go through fine and then one particular buffer's zero init ends up corrupting memory. I am attaching screenshots indicating that. The particular buffer for which this happens is highlighted below:

    LINKER GENERATED COPY TABLES

    __TI_cinit_table @ 00876ad4 records: 19, size/record: 8, table size: 152
    .fardata: load addr=0086ce64, load size=000099c8 bytes, run addr=0085f1c0, run size=0000a0f4 bytes, compression=rle
    .dataL1DSRAM: load addr=0087682c, load size=0000020b bytes, run addr=00f00000, run size=00000448 bytes, compression=rle
    .common_flags: load addr=00876a44, load size=00000009 bytes, run addr=1089f28c, run size=00000030 bytes, compression=rle
    .neardata: load addr=00876a50, load size=00000009 bytes, run addr=0083fd34, run size=0000000c bytes, compression=rle
    .bss: load addr=00876a5c, load size=00000008 bytes, run addr=0083fd28, run size=0000000c bytes, compression=zero_init
    .data: load addr=00876a64, load size=00000008 bytes, run addr=00880000, run size=00000328 bytes, compression=zero_init
    .data:WIFILIB_softSlicingTable64qam: load addr=00876a6c, load size=00000008 bytes, run addr=00f00448, run size=00000400 bytes, compression=zero_init
    .data:lookup:ORILIB_twiddle_factors_fft16x16_64: load addr=00876a74, load size=00000008 bytes, run addr=00f00c88, run size=00000100 bytes, compression=zero_init
    .data:tmp: load addr=00876a7c, load size=00000008 bytes, run addr=00f00a88, run size=00000200 bytes, compression=zero_init
    .far: load addr=00876a84, load size=00000008 bytes, run addr=00800200, run size=0003fb28 bytes, compression=zero_init
    .gem0_data: load addr=00876a8c, load size=00000008 bytes, run addr=10890000, run size=0000f28c bytes, compression=zero_init
    .gem0_dataL1DSRAM: load addr=00876a94, load size=00000008 bytes, run addr=10f01000, run size=00003530 bytes, compression=zero_init
    .gem1_data: load addr=00876a9c, load size=00000008 bytes, run addr=11890000, run size=00000e4c bytes, compression=zero_init
    .gem1_dataL1DSRAM: load addr=00876aa4, load size=00000008 bytes, run addr=11f01000, run size=000031f8 bytes, compression=zero_init
    .gem2_data: load addr=00876aac, load size=00000008 bytes, run addr=12890000, run size=000008f8 bytes, compression=zero_init
    .gem2_dataL1DSRAM: load addr=00876ab4, load size=00000008 bytes, run addr=12f01000, run size=000053c0 bytes, compression=zero_init
    .gem3_data: load addr=00876abc, load size=00000008 bytes, run addr=13890000, run size=000052a8 bytes, compression=zero_init
    .gem3_dataL1DSRAM: load addr=00876ac4, load size=00000008 bytes, run addr=13f01000, run size=00000330 bytes, compression=zero_init
    .shared_mem_noncacheable: load addr=00876acc, load size=00000008 bytes, run addr=e00e0000, run size=0000052c bytes, compression=zero_init

     The code for __TI_zero_init is supposed to come from copy_zero_init.c but I can't find it. It seems like it is linker generated as opposed to being part of the rts distribution. So I don't know what piece of C code is responsible for the corruption. I don't understand either why that is happening - gem2_dataL1DSRAM section doesn't overlap 0x00876A38. Why should that memory location get written to at all?

  • Thanks, at this point it sounds like it could be an issue w/ the C Initialization.  I'm moving this over to the C/C++ Forum and hopefully they can help more to resolve the issue.

    Best Regards,

    Chad

  • Manu Bansal said:
    The code for __TI_zero_init is supposed to come from copy_zero_init.c but I can't find it.

    The source code for RTS functions is in the file rtssrc.zip, found in the library directory.

    Your screenshots show __TI_zero_init having just gotten done writing to memory locations leading up to 0x12f063c0 (look at A3 and B6), but the memory window shows the memory locations leading up to 0x00876b80 were what actually changed.  This seems unlikely to be a compiler bug.  You mentioned earlier that you are mapping shared memory:

    Manu Bansal said:
    This is an Advantech 6670LE EVM. You are right, there is no DDR at 0xE0000000.  I am mapping the shared memory to that address range and setting the non-cacheable flag on it, both through software. This is so that I can use the shared memory as an L2 SRAM that stays coherent across cores since it is never cached in any L1.

    Is it possible that in this configuration, the memory around 0x12f00000 and the memory around 0x00800000 map to the same address?

  • I stepped through assembly again and this time with rts code associated with it. The part of code that ends up writing to the 0x008.. range is highlighted in the attached screenshot. It comes from copy_zero_init.c. As a specific symptom, when the dst1 address (intended write address) was 0x12F055F0, 16B zero-write to that address zeroed out 16B starting from 0x00876AE0. I looked through that piece of the code too and it all seems fine.

    Shared memory mapping doesn't seem to be the cause. Shared memory is the 0x0c.. range, which I'm mapping to 0xe0.. range. Neither of those is in picture here.

    However, I do suspect that some L1-L2 cache interaction could be the problem, unless there are other bugs. 0x008.. range is L2 SRAM and 0x12F... is core 2's L1D SRAM. Could this be a hardware writeback from L1 cache to L2? Like I mentioned earlier, the GEL configuration is all defaults, so at the time of auto init, L1 is all allocated as cache. Only when init finishes and control comes to main, I call a setup function that sets L1D as memory.

    For reference, here is some content from the linker generated memory map:

    MEMORY CONFIGURATION

    name origin length used unused attr fill
    ---------------------- -------- --------- -------- -------- ---- --------
    VECS 00800000 00000200 00000000 00000200 RWIX
    L2_TEXT 00800200 0007fe00 00076968 00009498 RWIX
    L2_DATA 00880000 00010000 00000328 0000fcd8 RWIX
    COMMOUT 008ecd00 00000080 00000000 00000080 RWIX
    COMMIN 008ecd80 00000080 00000000 00000080 RWIX
    L2_SRIO_DATA_IN 008ece00 00003000 00000000 00003000 RWIX
    L2_SRIO_DATA_OUT 008efe00 00003000 00000000 00003000 RWIX
    RESBLOCK 008f2e00 0000d200 00000000 0000d200 RWIX
    L1PCACHE 00e00000 00008000 00000000 00008000 RWIX
    L1DSRAM 00f00000 00001000 00000e07 000001f9 RWIX
    ISHAREDMCM 0c100000 00100000 00000000 00100000 RWIX
    C0_VECS 10800000 00000200 00000000 00000200 RWIX
    C0_L2_DATA 10890000 0005cd00 0000f2bc 0004da44 RWIX
    C0_COMMOUT 108ecd00 00000080 00000000 00000080 RWIX
    C0_COMMIN 108ecd80 00000080 00000000 00000080 RWIX
    C0_L2_SRIO_DATA_IN 108ece00 00003000 00000000 00003000 RWIX
    C0_L2_SRIO_DATA_OUT 108efe00 00003000 00000000 00003000 RWIX
    C0_RESBLOCK 108f2e00 0000d200 00000000 0000d200 RWIX
    C0_L1DSRAM 10f01000 00006000 00003530 00002ad0 RWIX
    C1_VECS 11800000 00000200 00000000 00000200 RWIX
    C1_L2_DATA 11890000 0005cd00 00000e4c 0005beb4 RWIX
    C1_COMMOUT 118ecd00 00000080 00000000 00000080 RWIX
    C1_COMMIN 118ecd80 00000080 00000000 00000080 RWIX
    C1_L2_SRIO_DATA_IN 118ece00 00003000 00000000 00003000 RWIX
    C1_L2_SRIO_DATA_OUT 118efe00 00003000 00000000 00003000 RWIX
    C1_RESBLOCK 118f2e00 0000d200 00000000 0000d200 RWIX
    C1_L1DSRAM 11f01000 00006000 000031f8 00002e08 RWIX
    C2_VECS 12800000 00000200 00000000 00000200 RWIX
    C2_L2_DATA 12890000 0005cd00 000008f8 0005c408 RWIX
    C2_COMMOUT 128ecd00 00000080 00000000 00000080 RWIX
    C2_COMMIN 128ecd80 00000080 00000000 00000080 RWIX
    C2_L2_SRIO_DATA_IN 128ece00 00003000 00000000 00003000 RWIX
    C2_L2_SRIO_DATA_OUT 128efe00 00003000 00000000 00003000 RWIX
    C2_RESBLOCK 128f2e00 0000d200 00000000 0000d200 RWIX
    C2_L1DSRAM 12f01000 00006000 000053c0 00000c40 RWIX
    C3_VECS 13800000 00000200 00000000 00000200 RWIX
    C3_L2_DATA 13890000 0005cd00 000052a8 00057a58 RWIX
    C3_COMMOUT 138ecd00 00000080 00000000 00000080 RWIX
    C3_COMMIN 138ecd80 00000080 00000000 00000080 RWIX
    C3_L2_SRIO_DATA_IN 138ece00 00003000 00000000 00003000 RWIX
    C3_L2_SRIO_DATA_OUT 138efe00 00003000 00000000 00003000 RWIX
    C3_RESBLOCK 138f2e00 0000d200 00000000 0000d200 RWIX
    C3_L1DSRAM 13f01000 00006000 00000330 00005cd0 RWIX
    DDR 80000000 40000000 00000000 40000000 RWIX
    ISHARED_NONCACHEABLE e0000000 00100000 000e052c 0001fad4 RWIX

  • I'm sorry, I don't know anything about how the cache works.  I don't see anything wrong with the generated code.  I think this thread needs to be moved back to the C6000 forum.

  • All right, I think I solved it. It turned out to be what I guessed - the GEL initialization script needed to reflect the same L1 and L2 memory configuration, in terms of cache vs memory allocation, as I was linking with. My specific configuration was L1P all cache (default), L1D 4K cache and 28K SRAM (not default) and L2 all SRAM (default). GEL had L1D also set as 32K cache. That meant that my software-based reconfiguration of L1D as part cache, part memory was too late. Auto init functions were still functioning with L1D set as all cache, while they were working on memory allocated with the split configuration causing memory corruption due to hardware writebacks.

    Thanks for the cues though.

  • Yes, when I started reading through this this morning and I saw the writes to L1D space, I was about ready to ask you to dump the cache configuration registers.  L1D and L1P are configured as full cache by default, and you would need to disable them in your code before using them as SDRAM.

    Glad you worked through this. 

    Best Regards,

    Chad