This thread has been locked.

If you have a related question, please click the "Ask a related question" button in the top right corner. The newly created question will be automatically linked to this question.

omapl138 cpu loading issue

Other Parts Discussed in Thread: OMAP-L138, OMAPL138

I do a experimentation trying to prove that CPU loading of Linux top on OMAP-L138 is a trouble.

I use the newest original TI image(linux kernel 3.3.0) on Davinci 03_22_00_06.

http://software-dl.ti.com/dsps/dsps_public_sw/psp/LinuxPSP/DaVinci_03_22/03_22_00_06/index_FDS.html

# uname -a                                                         

Linux DA850EVM 3.3.0+ #1 PREEMPT Fri May 31 09:28:38 IST 2013 armv5tejl GNU/Linx


And I use the cyclictest, a benchmark tool on the Linux.

Cyclictest https://rt.wiki.kernel.org/index.php/Cyclictest

https://kernel.googlesource.com/pub/scm/linux/kernel/git/clrkwllms/rt-tests.git/+archive/b0413ae5ed802004fb0c4af74a1757381fd2b91f.tar.gz

I find two special situation:

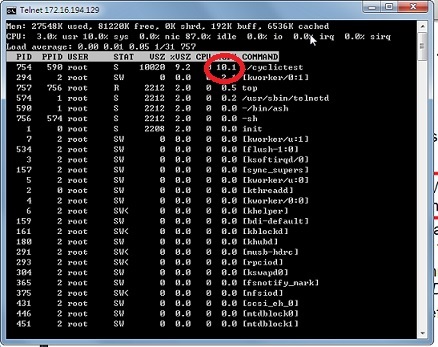
First, the loading(10%) of cyclictest on the OMAP-L138 is bigger than the other platform(almost less than 1%).


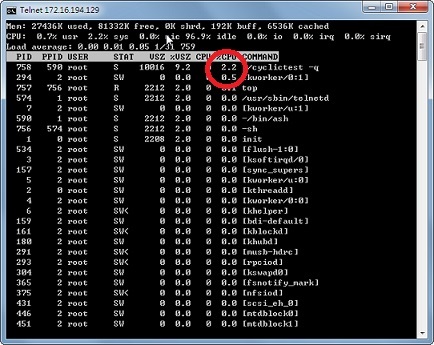
Second, if I add the "-q" parameter to cancel the monitor refresh of cyclictest every 10 msec, the loading is down to 2.2%.

I doubt the I/O driver of Linux or I/O architecture on OMAP-L138 have something wrong.

# ./cyclictest

# ./cyclictest -q


Could anyone explain this situation?

thanks


  • hello there,
    -q is for --quiet, which print only a summary on exit. So there will not be any load on cpu at that time when you fire "./cyclictest -q"
    probably there is no relation of this result with i/o driver or architecture of linux.


  • thanks, Nikunj

    I use "cyclictest " to test on omapl138 and dm368.

    both are ARM9. cpu clk rate is the same around 400MHz.

    cyclictest task take 1% cpu loading, but omapl138 is 10%.

    Why do they get different cpu loading base on same cpu architecture?

    Kai 

  • Kai,


    Since quiet option is making a difference, can you confirm the stdout is visible through the same medium (ie telnet) on both DM368 and OMAP-L138? If you are using serial console on DM368, that could shed some light on a possible cause of difference.


    Also, cyclictest is used for latency measurements. If you are in interested in CPU throughput measurement (likely since you are looking at top output), there are other benchmarking programs like lmbench geared towards that.


    Thanks,

    Sekhar

  • Hi Kai Wang,

    Kai says said:
    I doubt the I/O driver of Linux or I/O architecture on OMAP-L138 have something wrong.

    As of now, We have this information, so thought of sharing it with you.

    On OMAPL138 , performance measurements had been done for device drivers of DaVinci Linux PSP(Version: 03.22.00.02) and the CPU Loading % are projected for the following drivers at http://processors.wiki.ti.com/index.php/DaVinci_PSP_03.22.00.02_Device_Driver_Features_and_Performance_Guide#Performance_and_Benchmarks

    ALSA SoC Audio Driver
    Ethernet Driver
    NAND Driver
    NOR flash Driver
    SPI Flash Driver
    MMC/SD Driver
    USB Mass Storage Class Host Driver
    USB Mass Storage Class Slave Driver
    USB CDC/RNDIS Slave Driver
    SATA 18.1 Description
    Video Port Interface (VPIF)


    Regards,

    Shankari


    -------------------------------------------------------------------------------------------------------

    Please click the Verify Answer button on this post if it answers your question.
    --------------------------------------------------------------------------------------------------------

  • Hi KaiWang1,

    Apologize for the delayed reply as I resumed to work after my vacation.

    The following are our insights on this issue.

    1. Reasons of high CPU Load: ( CPU-bound load, Out of memory issues, and I/O-bound load. ) on TOP command

    If we look into the CPU percentage break up in your screenshots, the user and system's CPU consumption is 3.0% and 10.0% respectively. But the CPU I/O time is just 0.0%. if the I/O wait value is high then there is a chance of suspecting that the load is not CPU-bound but it is I/O bound. for example, due to RAM issues or high disk I/O.

    2. When we happened to just experiment the cyclictest on Ubuntu Linux 12.04 LTS Linux machine, we noticed just 2% CPU load for cyclic test and interestingly when we inserted a pendrive the cyclic test started consuming more CPU time i.e., 10 % as expected, though the /udevd takes just the 1% of CPU Load. This gives us to derive a logic that, when the latency measurements take more time in the cyclic test due to newly introduced interrupts or newly spanned process or someother user/system, interrupts, obviously the CPU time consumption will be more.

    3. Apart from these, we suspect that the type of booting( nfs booting/ SD/ Flash)  may also result in different CPU load percentage for Cyclic test. ( testing is in progress from our side w.r.t booting options) . And from your screenshot, I assume that you use NFS booting. If it is NFS booting, most likely, the ethernet interrupts might be very frequent due to which the CPU load may also go high.

    4. Please provide : What is the different type of booting, type of filesystem like Arago, Monta vista, type of mounting etc. used for DM365 Vs OMAPL138. ( for example, there might be some default process running on the standard filesystem packages)

    5. Usually the cyclic test will be used on RT Linux.( You might of already done!!). Make sure that the RT patches are applied on Davinci Linux 3.22 and enabled while building the kernel for both the platforms DM365 and OMAPL138.


    Regards,

    Shankari


  • Hi shankari:

    thanks for your reply.

    About Item 4. please see the below 

    DM365 :

                      IPNC ->  filesystem is arago. mounting via NFS.

                      EVM ->  filesystem is arago. mounting via Nand

    L138:

                      EVM ->  filesystem is arago. mounting via SD card