This thread has been locked.

If you have a related question, please click the "Ask a related question" button in the top right corner. The newly created question will be automatically linked to this question.

Problem: DSP is working slower than it is supposed to be (121 MHz instead of 500 MHz)

Hello,

We are using a 500MHz c6424. While running a nanosecond delay function which is taken from the evm module, we noticed that the function makes the delay more than it is supposed to be. The function may not provide a properly nanosecond delay, but it helped us notice there is a problem with our execution time.

The function is :

void nsdelay(unsigned long int nsec)
{                                                                               
volatile int nx = 0;                               

volatile int loop = (int)(nsec*8);                                          
for (nx = 0; nx < loop; nx++);
                   
}

The assembly view of the loop


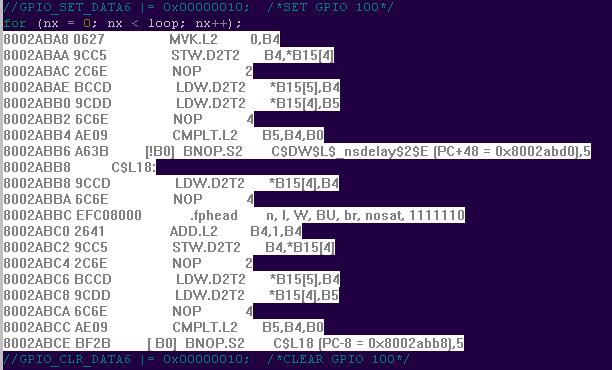
When I take just the loop time in the function by toggling a GPIO pin (nsec = 1), the value is 660 nanoseconds. So i calculated aprox. cycle counts just for the loop with the help of the assembly viewing by Code Composer, it is 78 cycles. While running on 500Mhz, cycle per nanosecond is 2. So instead of doing the operation on 156 nanoseconds, it longs 660 nanoseconds, which indicates our DSP is running on aprox. 121Mhz instead of 500Mhz.

Realizing that, I immediately checked the PLL setup but there is no visible problem with PLL. Registers are set with the correct values. Do you have any ideas or recommendations for this situation? Thanks a lot...

Erman

  • Hi,

    you're executing code from 0x8002xxxx, so from external memory. Is your L2 cache enabled?   It's not enabled by default at reset.

    See: http://tiexpressdsp.com/index.php/Enabling_64x%2B_Cache


    If you place code and/or data in external memory the processor will be very slow if the L2 cache is not enabled.

    In general on a cache base architecture like this one, the processing time might not be exactly the same each time you execute that loop, even with the cache enabled. So for precise time measurements you'd better use a hardware timer, in example with the CLK_gethtime() API of DSP/BIOS 5.

    Hope it helps
    Massimo

  • We are using L1 Program and Data cache as fully sized cache. L2 cache is fully configured as SRAM. I will move to code to the L2 Program location and check with the hardware timer, will post the results here.

    Thanks,

    Erman

  • Hi again,

    We are not using DSP/BIOS, can you give me an example or a link to the source code of CLK_gethtime?

    I did the calculations again, this time using the hardware timer. I used the TIMn register, which is a counter that is incremented within every cycle of the source clock (27 MHz). DSP runs on 486 MHz. So each time TIMn increments one, it means the DSP has completed 18 cycles.

    Let me summarize my code into three steps

    A) Set gpio 100 to 1

    B)Execute a for loop

    C)Set gpio 100 to 0

    I used emulator breakpoints to see how many cycles each step costs. (Any disadvantages of using the emulator?)

    The execution cycle counts are showing differences at some times, and I am not sure if this is OK. For example for three times:

    (A: 7 cycles B: 12 cycles C: 7 cycles), (A: 16 cycles B: 12 cycles C: 14 cycles), (A: 7 cycles B: 13 cycles C: 7 cycles)

    When I use the scope, I take overall time result of 580 nanoseconds. But none of the upper results match this timing value. (7+12+7 = 26 cycles with 27MHz clock---> 26*18 = 468 cycles with DSP clock----> 468 * 1.944 = 909.792 nanoseconds)

    Now everything gets more confused. Can you help me with that?

    Thanks,

    Erman


  • Erman,

    You have to take into account the CPU pipeline flush if you're measuring a very very short interval. Don't try to measure 10-30 cycles setting emulator breakpoints on the C6000. 100s cycles or more are ok. 

    Your 27MHz clock reference should be correct.
    In alternative you can also get cycle count information with CCS and the emulator (menu profile -> clock enable /clock view). The details are different using CCS 3 or 4, please refer to the CCS help for that.  Basically if you set 2 breakpoint, this emulation timer can tell you how many cpu cycles elapsed between the two. The CCS profiler uses the same technology, for simulator and emulator.

    The execution time might be different when executing code multiple times, L1 cache is anyway enabled and can cause some jitter.

    Hope this help.

    Best regards
    Msssimo

    PS: Using a little bit of DSP/BIOS can only help you. It will not cause perfomance penalties. And on a device like the DM643x,  it will make your life easier.
    Almost all our application code and our drivers for DM643x are based on DSP/BIOS 5.

  • Hi again,

    Thank you for your answers. We verified our DSP runs on 486 MHz, which is the correct value with the help of the menu profile. We did some more advanced time calculations and found that a single iteration of the loop is about 45 nanoseconds.

    The rest of the time belongs to GPIO access, which is a surprise for us because it takes nearly 200 nanoseconds to set and clear a GPIO register. Is there any time specifications with the GPIO registers or any other internal registers?

    Also, another important part is, we added a read operation from DDR2 and saw the time value increases abnormally.

    -Set gpio 100 to 1

    -read a 32 bit value from DDR2

    -For loop

    -Clear gpio 100 to 0

    The second step alone adds a 200 nanosecond to the operation! So basically it seems like DDR2 is running on 5 MHz instead 166 MHz *2.

    The next step I will do is check the cache initialization (I did that at the past) and also the DDR2 initialization (didn't check this before). Though we are using the initialize function that is taken from the evmc6424 gel file, so there should not be a problem.

    Do you have any further ideas?

    Thanks,

    Erman

  • Elric said:
    So basically it seems like DDR2 is running on 5 MHz instead 166 MHz *2.

    And of course it's not!  The internal bus and the memory architecture are not optimized for a single memory access to DDR.

    You must enable the cache L2 to see improvements. You already have the pointer to the wiki article.
    It's a cache: so the first memory access will be slow, but you will load the word that you need and some neighbors. A memory access to these neiughbors already in cache will be faster.

    You can also load some critical data il L1D SRAM: L1D is 80K but only 32K can be configured as cache. The other 56K are the fastest data memory in the system.
    You can create your own sections with pragma DATA_SECTION() in C and allocate some variable in L1D.

    I wish you a good time with the DM643x. It's a good device.

    Best regards
    Massimo

  • Mr Martelli,

    Our problems are mostly gone now. I didn't know that DDR2 is default NON cacheable. So there was no MAR configuration in our code. 

    Firstly I made the DDR2 cacheable and then allocated a 32KB portion of L2 as cache. L1 is fully cache as I mentioned before. Now our code runs as a beast compared to the previous state.

    By the way I am working on C6424, though before that I was working on a DM6437. It was indeed fun.

    Thanks for all the help,

    Erman