


Other Parts Discussed in Thread: SYSBIOS
I am running the RTOS kernel on a F28069 launchpad and my code runs fine for about 2.5hrs. The typical thread profile is as shown below.

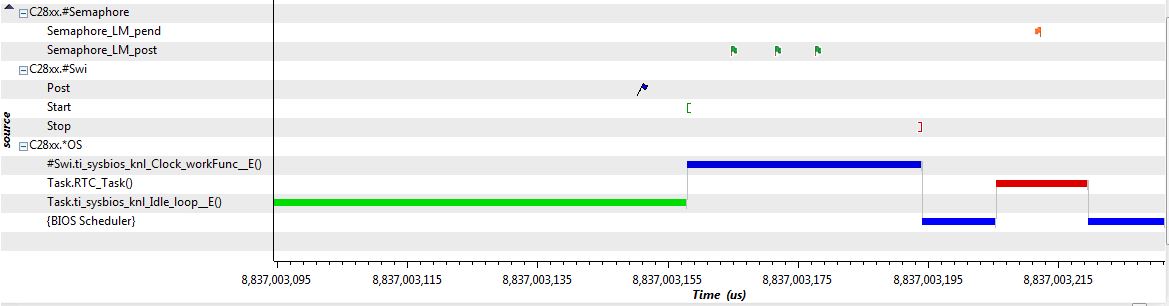
However, as soon as I hit that 2.5hr mark, the system goes into an infinite loop and I believe its is because of the following thread profile.
I have copied and pasted the some of the data from the Execution Anaylsis profile below.
------------------------------ No Error-----------------------------
,8836993150611,,C28xx,"LM_post: swi: 0xd122, func: 0x3da993, pri: 15",Post,SWI,ti_sysbios_knl_Clock_workFunc__E(),,826,SYSBIOS System Logger,_ti.uia.events.UIASWICtx,ti.sysbios.knl.Swi,,,795329383555,0xD122,0x3DA993,0xF,0x0,,,,,
------------------------------ Error-----------------------------
,8837003164700,,C28xx,"LM_post: sem: 0xd600, count: 0",Semaphore_LM_post,Unknown,,,837,SYSBIOS System Logger,ti.sysbios.knl.Semaphore,ti.sysbios.knl.Semaphore,,,795330284823,0xD600,0x0,,,,,,,
,8837003171511,,C28xx,"LM_post: sem: 0xd646, count: 168",Semaphore_LM_post,Unknown,,,838,SYSBIOS System Logger,ti.sysbios.knl.Semaphore,ti.sysbios.knl.Semaphore,,,795330285436,0xD646,0xA8,,,,,,,
,8837003177655,,C28xx,"LM_post: sem: 0xd63c, count: 0",Semaphore_LM_post,Unknown,,,839,SYSBIOS System Logger,ti.sysbios.knl.Semaphore,ti.sysbios.knl.Semaphore,,,795330285989,0xD63C,0x0,,,,,,,
I have no idea where those 3 semaphores come from because they are not there for 2.5hrs.


