Hi,
I am trying to run some TI sample FFT code from DSPF_sp_fftSPxSP_d.c on a dra7xx dsp core.
I am using dsplib_c66x_3_4_0_0 library and building the sample code in CCS6.
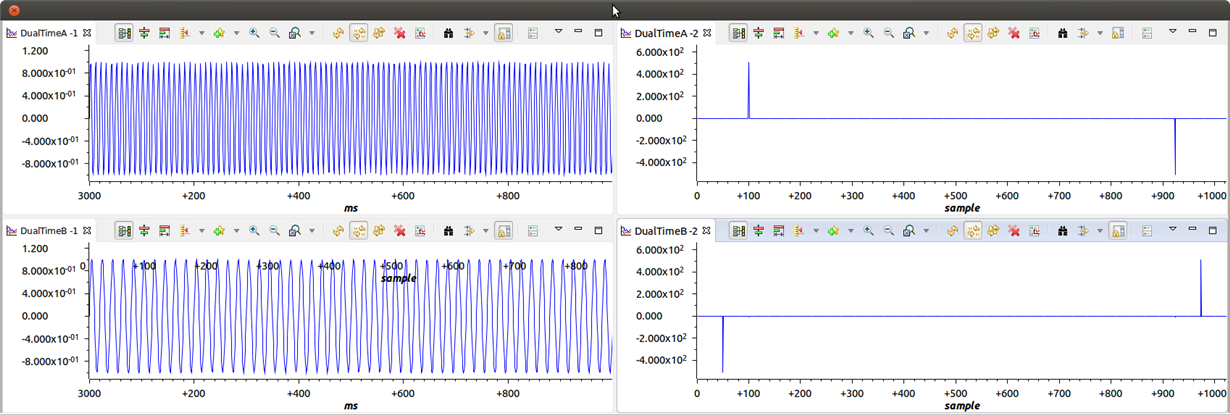
When I try to run this sample code via debugger and plot the values of ptr_x_cn_orig ( I modified my code to copy 'ptr_x_cn' to 'ptr_x_cn _orig' ) using the graph tool in CCS6, I can see two sine waves, one with 50Hz and the other with 100Hz frequency being provided as input to DSPF_sp_fftSPxSP_cn() function.
I am able to plot a graph of the FFT output as well. I am attaching all the graphs below.
DualTimeA-1 - Input 100Hz
DualTimeB-1 - Input 50Hz
DualTimeA-2 - Output showing 100Hz freq component
DualTimeB-2 - Output showing 50Hz freq component
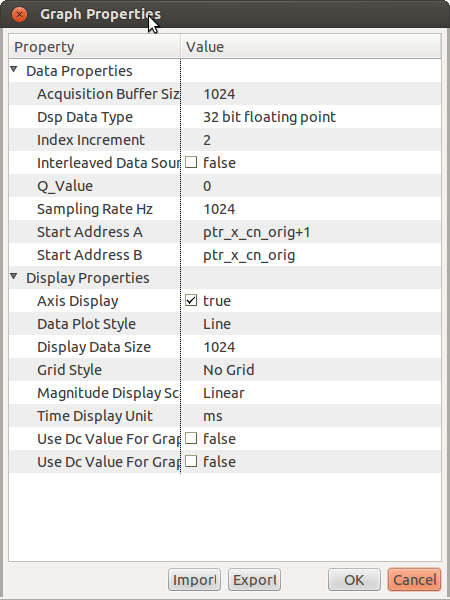
The following are the settings for input and output graphs respectively.
Input:
Output:
Now my question is, I am not sure if the FFT output received is valid?
When I look at the FFT output of a sine wave in LabView, I see that the output shows both the freq component and its mirror as positive. I do not see any freq component with negative amplitude. But in the output of the sample code, I see that there is a frequency component( Mirror component) with negative amplitude. This is the case for both the frequencies.
Am I missing some graph setting? Do my CCS graph settings look right?
Can I use dual time graphs in CCS to plot FFT outputs?
Are these FFT output valid? How can I validate them?
Let me know if any more information is needed.
Thanks.


