This thread has been locked.

If you have a related question, please click the "Ask a related question" button in the top right corner. The newly created question will be automatically linked to this question.

Partial debug/remoteproc trace0 output

Other Parts Discussed in Thread: AM5728, SYSBIOS

Using Linux (ARM) and Sys/Bios (DSP) on AM5728.  Compiler 8.1.0, IPC 3.42.0.0.2, Sys/Bios 6.45.1.29, XDC 3.32.0.06

I am using Log_print on the DSP to put debug info into the TRACE buffer.  I can view the trace buffer via

cat /sys/kernel/debug/remoteproc/remoteproc2/trace0

On an older build I had (months old and not recreatable unfortunately) I would get the entire contents of the TRACE buffer displayed correctly.

Now with my current build I only see the first three lines in the log:

[      0.000] [t=0x0002a6ce] ti.sdo.utils.MultiProc: --> getClusterId: (0x4)
[      0.000] [t=0x00031c3a] ti.sdo.utils.MultiProc: <-- getClusterId: 0x4
[      0.000] 20 Resource entries at 0x80000000

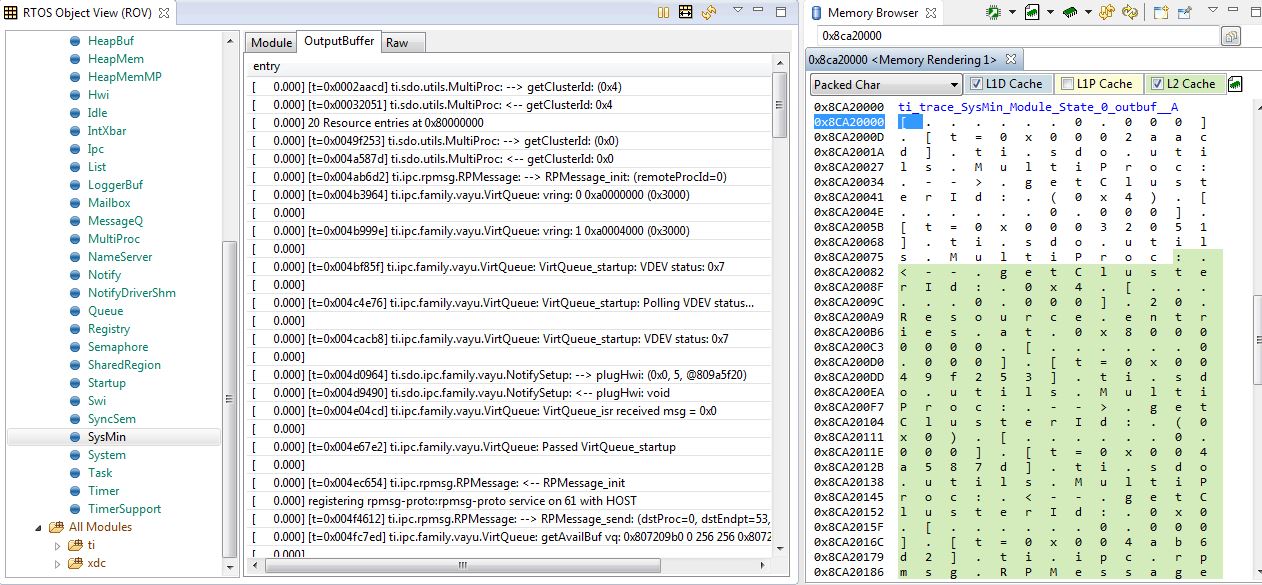
When I connect to the DSP via the debugger and view SysMin in the ROV tool, I see there is actually much more in the buffer, but the Linux side is not seeing it.

[      0.000] [t=0x0002a6ce] ti.sdo.utils.MultiProc: --> getClusterId: (0x4)

[      0.000] [t=0x00031c3a] ti.sdo.utils.MultiProc: <-- getClusterId: 0x4

[      0.000] 20 Resource entries at 0x80000000

[      0.000] [t=0x0049ec35] ti.ipc.transports.TransportRpmsgSetup: TransportRpmsgSetup_attach: procId=0

[      0.000] [t=0x004a6e34] ti.sdo.utils.MultiProc: --> getClusterId: (0x0)

[      0.000] [t=0x004ab577] ti.sdo.utils.MultiProc: <-- getClusterId: 0x0

[      0.000] [t=0x004b0e82] ti.ipc.transports.TransportRpmsg: TransportRpmsg_Instance_init: remoteProc: 0

[      0.000] [t=0x004b7765] ti.ipc.rpmsg.RPMessage: --> RPMessage_init: (remoteProcId=0)

and 20 or so more lines available after that.

So, I am trying to figure out why Linux is not showing me the full buffer of log data.

Thanks,

Chris Peters

  • I have notified the software team. They will respond here.
  • Chris,

    If you turn off Registry.common$.diags_INFO in Dsp1.cfg, does it still print the first 3 lines only? You may try to match with Dsp1.cfg in ex02_message example.

    If you look into ti_trace_SysMin_Module_State_0_outbuf__A from memory browser instead of ROV, do you see the complete log as well?

    And how does your TYPE_TRACE entry look like in rsc table?

    Regards,
    Garrett
  • Here is my changed cfg for logging.  I'll admit I don't completely understand all that, but it did seem to work previously.

    /*
     *  ======== Instrumentation Configuration ========
     */
    xdc.useModule('xdc.runtime.Assert');
    xdc.useModule('xdc.runtime.Error');
    xdc.useModule('xdc.runtime.Registry');

    var Log     =   xdc.useModule('xdc.runtime.Log');

    /*
    ** Sets up the exception log so you can read it with ROV in CCS
    */
    var LoggerBuf = xdc.useModule('xdc.runtime.LoggerBuf');
    var Exc = xdc.useModule('ti.sysbios.family.c64p.Exception');
    Exc.common$.logger = LoggerBuf.create();
    Exc.enablePrint = true; /* prints exception details to the CCS console */

    /* system logger */
    var LoggerSys = xdc.useModule('xdc.runtime.LoggerSys');
    var LoggerSysParams = new LoggerSys.Params();
    var Defaults = xdc.useModule('xdc.runtime.Defaults');
    Defaults.common$.logger = LoggerSys.create(LoggerSysParams);

    /* enable runtime Diags_setMask() for non-XDC spec'd modules */
    var Diags = xdc.useModule('xdc.runtime.Diags');
    Diags.setMaskEnabled = true;
    /*Defaults.common$.diags_INFO = Diags.RUNTIME_ON;*/
    Defaults.common$.diags_INFO = Diags.ALWAYS_OFF;
    Defaults.common$.diags_ENTRY = Diags.RUNTIME_ON;
    Defaults.common$.diags_EXIT = Diags.RUNTIME_ON;

    /* override diags mask for selected modules */
    xdc.useModule('xdc.runtime.Main');
    Diags.setMaskMeta("xdc.runtime.Main",
        Diags.ENTRY | Diags.EXIT , Diags.RUNTIME_ON);
    /*    Diags.ENTRY | Diags.EXIT | Diags.INFO, Diags.RUNTIME_ON);*/

    var Registry = xdc.useModule('xdc.runtime.Registry');
    Registry.common$.diags_ENTRY = Diags.RUNTIME_ON;
    Registry.common$.diags_EXIT  = Diags.RUNTIME_ON;
    /*Registry.common$.diags_INFO  = Diags.RUNTIME_ON;*/
    Registry.common$.diags_INFO  = Diags.ALWAYS_OFF;
    Registry.common$.diags_USER1 = Diags.RUNTIME_ON;
    Registry.common$.diags_LIFECYCLE = Diags.RUNTIME_ON;
    Registry.common$.diags_STATUS = Diags.RUNTIME_ON;

    var Main = xdc.useModule('xdc.runtime.Main');
    Main.common$.diags_ASSERT = Diags.ALWAYS_ON;
    Main.common$.diags_INTERNAL = Diags.ALWAYS_ON;

    I attempted to turn of diags_INFO, left the original lines in a commented.

    The dump from Linux is the same:

    [      0.000] [t=0x0002aacd] ti.sdo.utils.MultiProc: --> getClusterId: (0x4)
    [      0.000] [t=0x00032051] ti.sdo.utils.MultiProc: <-- getClusterId: 0x4
    [      0.000] 20 Resource entries at 0x80000000

    Yes, the memory browser shows the entire log as does SysMin from the ROV tool.  See pic below.

    Stuff from the Rsc_table:

    // NOTE:  The IPC_DATA address and TRACE Buffer address must match.  The TRACE buffer address is setup in the platform config.
    #define DSP_MEM_IPC_DATA        0x8CA20000  // This will be right before the FPGA region below.  It is in the
    #define DSP_MEM_IPC_DATA_SIZE   SZ_1M       // Platform definition also, but unused.

    extern char ti_trace_SysMin_Module_State_0_outbuf__A;
    #define TRACEBUFADDR (UInt32)&ti_trace_SysMin_Module_State_0_outbuf__A

        {
            TYPE_TRACE, TRACEBUFADDR, 0x8000, 0, "trace:dsp",
        },

    My platform file has this:

    IPC_DATA 0x8c920000 0x00100000 code/data RWX

    TRACE_BUF 0x8ca20000 0x00060000 code/data RWX

    I'm not sure, don't recall, why I made the comment that the IPC_DATA and TRACE_BUF address must match.  However, I also note that it is not used in the Platform file.  So that is a bit confusing.

  • Chris,

    Usually we don't see any trace at all if there is an issue on remoteProc or remote core image.
    Can you upload the DSP map file here? It may help us find something very unusual...

    Regards,
    Garrett
  • I don't think I can post the entire map file, that might be too revealing about our project. I can post TI specific parts if you can narrow down what you are looking for.
  • Understand. Can you grep .tracebuf in your project directory and post output here like below? If you can remove your project specific code, and post a cut-down CCS project for reproducing the problem on AM572x EVM, that would be very helpful.

    $ grep .tracebuf -R .
    ./Dsp1.cfg:Program.sectMap[".tracebuf"] = "TRACE_BUF";
    Binary file ./bin/debug/server_dsp1.xe66 matches
    ./bin/debug/obj/server_dsp1.xe66.map: 9f000000 9f000000 00008004 00000000 rw- .tracebuf
    ./bin/debug/obj/server_dsp1.xe66.map: 951729f0 00000008 (.cinit..tracebuf.load) [load image, compression = zero_init]
    ./bin/debug/obj/server_dsp1.xe66.map:.tracebuf
    ./bin/debug/obj/server_dsp1.xe66.map: 9f000000 00008004 Dsp1_pe66.oe66 (.tracebuf)
    ./bin/debug/obj/server_dsp1.xe66.map: .tracebuf: load addr=951729f0, load size=00000008 bytes, run addr=9f000000, run size=00008004 bytes, compression=zero_init
    ./bin/debug/configuro/package/cfg/Dsp1_pe66.xdl: .tracebuf: load > TRACE_BUF
    ./bin/debug/configuro/package/cfg/Dsp1_pe66.c:#pragma DATA_SECTION(ti_trace_SysMin_Module_State_0_outbuf__A, ".tracebuf");
    ./bin/debug/configuro/package/cfg/Dsp1_pe66.c:#pragma DATA_SECTION(ti_trace_SysMin_Module_State_0_readidx__A, ".tracebuf");
    ./bin/debug/configuro/package/cfg/Dsp1_pe66.c:#pragma DATA_SECTION(ti_trace_SysMin_Module_State_0_writeidx__A, ".tracebuf");
    ./bin/debug/configuro/package/cfg/Dsp1_pe66.cfg.xml: <feature name="sectMap" type="object"><map id='xdc.cfg.Program/sectMap' length='4'><entry key='.tracebuf'>TRACE_BUF</entry><entry key='.errorbuf'>EXC_DATA</entry><entry key='.vecs'>xdc.services.intern.xsr.Value$Obj@6be4cb82::xdc.cfg.Program.SectionSpec#0</entry><entry key='.resource_table'>xdc.services.intern.xsr.Value$Obj@79ecfb24::xdc.cfg.Program.SectionSpec#1</entry></map>
    Binary file ./bin/debug/configuro/package/cfg/Dsp1_pe66.oe66 matches
    ./bin/debug/configuro/linker.cmd: .tracebuf: load > TRACE_BUF

    -Garrett
  • Here is the grep output.  It will take me longer to get the test project.  One point though, could this not be a Linux side issue.  The DSP appears to be putting the data into the buffer just fine.  It would seem like Linux has the problem pulling it out.  Like it does not know how much is there.  Maybe DSP and Linux disagree on the R/W pointers?

    Binary file ./Bin/Test/TestDsp.xe66 matches
    ./Bin/Test/TestDsp.map:  8ca20000    8ca20000    00008004   00000000    rw- .tracebuf
    ./Bin/Test/TestDsp.map:                  84ee3980    00000008     (.cinit..tracebuf.load) [load image, compression = zero_ini
    t]
    ./Bin/Test/TestDsp.map:.tracebuf
    ./Bin/Test/TestDsp.map:                  8ca20000    00008004     Test_pe66.oe66 (.tracebuf)
    ./Bin/Test/TestDsp.map:       .tracebuf: load addr=84ee3980, load size=00000008 bytes, run addr=8ca20000, run size=00008004 b
    ytes, compression=zero_init
    ./Bin/UnitTest/TestDsp.map:  8ca20000    8ca20000    00008004   00000000    rw- .tracebuf
    ./Bin/UnitTest/TestDsp.map:                  84ed9f24    00000008     (.cinit..tracebuf.load) [load image, compression = zero
    _init]
    ./Bin/UnitTest/TestDsp.map:.tracebuf
    ./Bin/UnitTest/TestDsp.map:                  8ca20000    00008004     Test_pe66.oe66 (.tracebuf)
    ./Bin/UnitTest/TestDsp.map:   .tracebuf: load addr=84ed9f24, load size=00000008 bytes, run addr=8ca20000, run size=00008004 b
    ytes, compression=zero_init
    Binary file ./Bin/UnitTest/TestDsp.xe66 matches
    ./Build/UnitTest/configPkg/package/cfg/Test_pe66.c:#pragma DATA_SECTION(ti_trace_SysMin_Module_State_0_outbuf__A, ".tracebuf"
    );
    ./Build/UnitTest/configPkg/package/cfg/Test_pe66.c:#pragma DATA_SECTION(ti_trace_SysMin_Module_State_0_readidx__A, ".tracebuf
    ");
    ./Build/UnitTest/configPkg/package/cfg/Test_pe66.c:#pragma DATA_SECTION(ti_trace_SysMin_Module_State_0_writeidx__A, ".tracebu
    f");
    ./Build/UnitTest/configPkg/package/cfg/Test_pe66.xdl:    .tracebuf: load > TRACE_BUF
    ./Build/UnitTest/configPkg/package/cfg/Test_pe66.cfg.xml:            <feature name="sectMap" type="object"><map id='xdc.cfg.P
    rogram/sectMap'  length='26'><entry key='.resource_table'>xdc.services.intern.xsr.Value$Obj@14715d4::xdc.cfg.Program.SectionSpec#0</ent
    ry><entry key='.vecs'>EXT_RAM</entry><entry key='.cinit'>EXT_RAM</entry><entry key='.init_array'>EXT_RAM</entry><entry key='.cio'>EXT_R
    AM</entry><entry key='.rodata'>EXT_RAM</entry><entry key='.neardata'>EXT_RAM</entry><entry key='.far'>EXT_RAM</entry><entry key='.bss'>
    EXT_RAM</entry><entry key='.const'>EXT_RAM</entry><entry key='.text'>EXT_RAM</entry><entry key='.switch'>EXT_RAM</entry><entry key='.st
    ack'>EXT_RAM</entry><entry key='.fardata'>EXT_RAM</entry><entry key='.far:taskStackSection'>EXT_RAM</entry><entry key='systemHeap'>EXT_
    RAM</entry><entry key='myHeapSection'>EXT_RAM</entry><entry key='.UnitTestData'>EXT_RAM</entry><entry key='.calibration_Data'>CAL_RAM</
    entry><entry key='.fpga_Download'>FPGA_RAM</entry><entry key='.hpi_Log_Data'>HPI_RAM</entry><entry key='BOARD_IO_DELAY_DATA'>OCMC_RAM1<
    /entry><entry key='BOARD_IO_DELAY_CODE'>OCMC_RAM1</entry><entry key='.tracebuf'>TRACE_BUF</entry><entry key='.noncached_Program_Data'>L
    2SRAM</entry><entry key='.bionic_Data'>EXT_RAM</entry></map>
    Binary file ./Build/UnitTest/configPkg/package/cfg/Test_pe66.oe66 matches
    ./Build/UnitTest/configPkg/linker.cmd:    .tracebuf: load > TRACE_BUF
    ./Build/UnitTest/TestDsp_linkInfo.xml:         <name>.cinit..tracebuf.load</name>
    ./Build/UnitTest/TestDsp_linkInfo.xml:         <name>.tracebuf</name>
    ./Build/UnitTest/TestDsp_linkInfo.xml:         <name>.tracebuf</name>
    ./Build/UnitTest/TestDsp_linkInfo.xml:            <name>.tracebuf</name>
    ./Build/Test/TestDsp_linkInfo.xml:         <name>.cinit..tracebuf.load</name>
    ./Build/Test/TestDsp_linkInfo.xml:         <name>.tracebuf</name>
    ./Build/Test/TestDsp_linkInfo.xml:         <name>.tracebuf</name>
    ./Build/Test/TestDsp_linkInfo.xml:            <name>.tracebuf</name>
    ./Build/Test/configPkg/package/cfg/Test_pe66.c:#pragma DATA_SECTION(ti_trace_SysMin_Module_State_0_outbuf__A, ".tracebuf");
    ./Build/Test/configPkg/package/cfg/Test_pe66.c:#pragma DATA_SECTION(ti_trace_SysMin_Module_State_0_readidx__A, ".tracebuf");
    ./Build/Test/configPkg/package/cfg/Test_pe66.c:#pragma DATA_SECTION(ti_trace_SysMin_Module_State_0_writeidx__A, ".tracebuf");

    ./Build/Test/configPkg/package/cfg/Test_pe66.xdl:    .tracebuf: load > TRACE_BUF
    ./Build/Test/configPkg/package/cfg/Test_pe66.cfg.xml:            <feature name="sectMap" type="object"><map id='xdc.cfg.Progr
    am/sectMap'  length='26'><entry key='.resource_table'>xdc.services.intern.xsr.Value$Obj@1284c88::xdc.cfg.Program.SectionSpec#0</entry><
    entry key='.vecs'>EXT_RAM</entry><entry key='.cinit'>EXT_RAM</entry><entry key='.init_array'>EXT_RAM</entry><entry key='.cio'>EXT_RAM</
    entry><entry key='.rodata'>EXT_RAM</entry><entry key='.neardata'>EXT_RAM</entry><entry key='.far'>EXT_RAM</entry><entry key='.bss'>EXT_
    RAM</entry><entry key='.const'>EXT_RAM</entry><entry key='.text'>EXT_RAM</entry><entry key='.switch'>EXT_RAM</entry><entry key='.stack'
    >EXT_RAM</entry><entry key='.fardata'>EXT_RAM</entry><entry key='.far:taskStackSection'>EXT_RAM</entry><entry key='systemHeap'>EXT_RAM<
    /entry><entry key='myHeapSection'>EXT_RAM</entry><entry key='.UnitTestData'>EXT_RAM</entry><entry key='.calibration_Data'>CAL_RAM</entr
    y><entry key='.fpga_Download'>FPGA_RAM</entry><entry key='.hpi_Log_Data'>HPI_RAM</entry><entry key='BOARD_IO_DELAY_DATA'>OCMC_RAM1</ent
    ry><entry key='BOARD_IO_DELAY_CODE'>OCMC_RAM1</entry><entry key='.tracebuf'>TRACE_BUF</entry><entry key='.noncached_Program_Data'>L2SRA
    M</entry><entry key='.bionic_Data'>EXT_RAM</entry></map>
    Binary file ./Build/Test/configPkg/package/cfg/Test_pe66.oe66 matches
    ./Build/Test/configPkg/linker.cmd:    .tracebuf: load > TRACE_BUF

  • Chris,

    Have you checked dmesg on Linux side? If there is trace buffer size issue, the DSP image should have failed to bootup, and if there is trace buffer read pointer issue, I would expect the beginning log is skipped though.

    IPC_DATA section should not have been used if you look into DSP map file, did you try to remove the IPC_DATA section from DSP config file, and define TRACE_BUF to 0x8c920000 to align with what is defined in rsc table "#define DSP_MEM_IPC_DATA 0x8c920000"? This would be matching with ex02_messageq Dsp1.cfg and default rsc table. (It seems you use different way to allocate .tracebuf to TRACE_BUF? I don't see your grep print Program.sectMap[".tracebuf"] = "TRACE_BUF";  )

    Regards,
    Garrett

  • The DSP is booting up and running correctly, so I don't think dmesg is going to have anything interesting in it.  I see the TRACE_BUF at the expected location and appears to be correct via the ROV Tool or direct memory display.

    I did not quite grep all the cfg files for this project, sorry about that.  I can assure you I do have

    Program.sectMap[".tracebuf"]               = "TRACE_BUF";

    in the .cfg setup.

    I did remove the IPC_DATA from the platform file and I changed the addressed of TRACE_BUF to 0x8c920000.  Same behavior.  Linux only shows the first three lines, ROV and Memory Browser shows it all. 

    Stuff from Resource Table:

    #define DSP_MEM_IPC_DATA        0x8C920000  // This will be right before the FPGA region below.  It is in the
    #define DSP_MEM_IPC_DATA_SIZE   SZ_1M       // Platform definition also, but unused.

    extern char ti_trace_SysMin_Module_State_0_outbuf__A;
    #define TRACEBUFADDR (UInt32)&ti_trace_SysMin_Module_State_0_outbuf__A

        {
            TYPE_TRACE, TRACEBUFADDR, 0x8000, 0, "trace:dsp",
        },

    From the .map file:

    TRACE_BUF             8c920000   00060000  00008004  00057ffc  RW X

    8c920000    8c920000    00008004   00000000    rw-
      8c920000    8c920000    00008004   00000000    rw- .tracebuf

    From the .cfg file:

    Program.sectMap[".tracebuf"]               = "TRACE_BUF";

    From the platform file:

    TRACE_BUF  0x8c920000 0x00060000 code/data RWX

    Suppose it could be the size difference between 0x00060000 and 0x00008004?

  • The trace buffer size difference should not be the culprit of preventing trace printout. The same size configuration works for ex02_messageq on EVM. The trace buffer is allocated from CMA region, have you changed the CMA address/range recently as you didn't have such issue "on an older build"?

    I will look into the remoteproc driver. And you may try to recreate the issue on EVM.

    Regards,
    Garrett