This thread has been locked.

If you have a related question, please click the "Ask a related question" button in the top right corner. The newly created question will be automatically linked to this question.

RTOS: EtherCAT Sync0 jitter

Other Parts Discussed in Thread: SYSBIOS

Tool/software: TI-RTOS

Hello everyone,

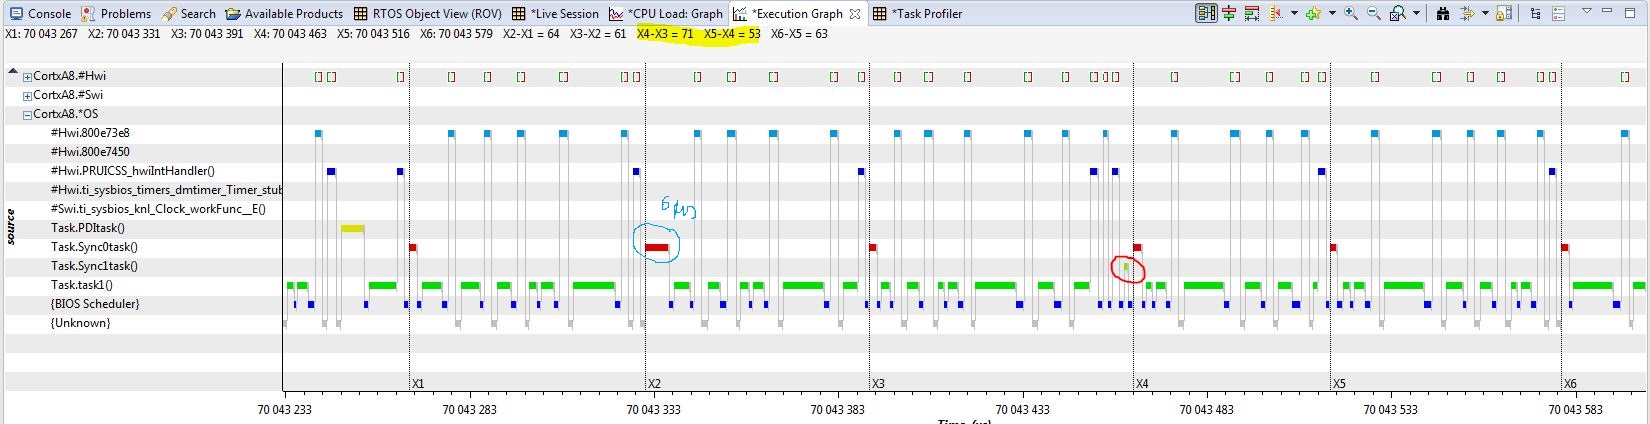
I have recently discover a bad behavior on my Ethercat Synchronization.
My configuration is the following one:

- Sitara ARM3359
- Code Composer Studio version CCS 6.1.2.00015
- SYS/BIOS 6.45.01.29 Real Time Operating System
- XDC Tool 3.32.00.06
- Compiler GNU v4.8.4 (Linaro)
- NDK 2.24.3.35
- Sysbios sdk 2.1.3.2
- software Texas Instrument ecat_appl with beckoff path v5.11

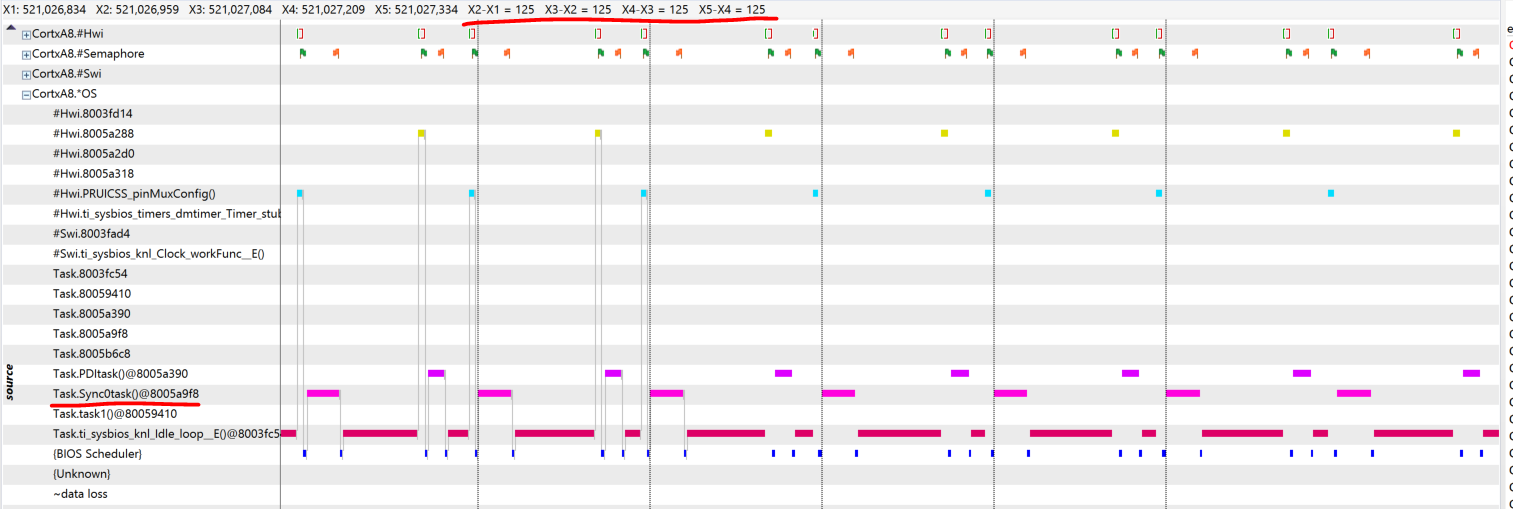
My Ethercat frames are configured with 500us cycle time.
I have enabled the DC synchro with subordinated cycle: Sync0 cycle time is 62.5us/ Sync1 cycle time is 500us.

I have made several test on Sync0 jitter which should be very little in this configuration and the reseults are awful : I have  a jitter of +- 10us which is horrible for us !

Can someone explain me this jitter and how to do to reduce it a lot ?
Thanks for your help.

Laurence

  • I've moved this to the device forum.
  • Hi Laurence,

    On your board, what crystal frequency do you have connected to OSC0 (XTALIN/XTALOUT pins)?

    Regards,
    Melissa
  • Hello Melissa,

    We have 24Mhz on XTALOut (V11) / XTalIn (V10).

    And we have 32.768KHz on RTC_XTALOUT (A4).

    Is there anything to deal with ?

    Thanks

    Laurence

  • Hi Laurence, I found at the end of Running AM335x EtherCAT application in DC mode link an sketch that shows how to measure jitter. I was wondering if this is the way you are measuring it. If not could you please let us know how your jitter test works?

    thanks,

    Paula

  • Hello Paula,

    In fact I'm working on my own board which is very similar to the ice v2 board.
    Unfortunately, I don't have a sync0 pin on my board so I can't measure the jitter as you explain in the TI Document.
    So we have activated a Sitara output at the beginning of sync0 ISR and with a scope we have made a configuration to cath the largest and the smallest tick (which is supposed to be 62.5us).
    With this method, we have catch tick at 54us then 70us (there is always a small tick then a large tick).
    can you explain me why ?
    Thanks a lot
    Laurence
  • Hi Laurence,

    it looks like you are mainly measuring the SW ISR jitter here. You are generating a high ISR load to the processor just for measuring. But there should be some other ISRs too... So your sync ISRs may have to wait for completion of other ISRs.
    To measure HW Sync0 clock jitter you really need a HW pin as the result is expected to be in the 10s or 100s of ns and not 10us. And you need a scope to compare reference clock with slave devices clocks.

    Regards,
    Frank
  • Hi Frank !

    Yes, I agree that I only measure SW ISR jitter in that way.

    But, for my project interest, I want this jitter to be smaller as possible (not 10us on the Sync0 cycle time of 62.5us).

    So, I think I have put the highest priority on my Sync0 isr: no other isr can interrupt it and the sw jitter can't be due to an interruption.

    I have created 6 tasks with different priority and 1 isr (topZIsr).

        Task_Params_init(&taskParams);
        taskParams.priority = 4;
        tsk1 = Task_create(task1, &taskParams, NULL);

        Task_Params_init(&taskParams);
        taskParams.priority = 6;
        taskParams.stackSize = 1512;
        taskParams.arg0 = (UArg)pruIcss1Handle;
        pdiTask = Task_create(PDItask, &taskParams, NULL);

        Task_Params_init(&taskParams);
        taskParams.priority = 8;
        taskParams.stackSize = 1512;
        taskParams.arg0 = (UArg)pruIcss1Handle;
        sync0Task = Task_create(Sync0task, &taskParams, NULL);

        Task_Params_init(&taskParams);
        taskParams.priority = 8;
        taskParams.stackSize = 1512;
        taskParams.arg0 = (UArg)pruIcss1Handle;
        sync1Task = Task_create(Sync1task, &taskParams, NULL);
     
        Task_Params_init(&taskParams);
        taskParams.priority = 4;
        taskParams.stackSize = 1512;
        ledTaskHndl = Task_create(LEDtask, &taskParams, NULL);

        Task_Params_init(&taskParams);
        taskParams.priority = 4;
        taskParams.stackSize = 1512;
        axisMainTaskHndl = Task_create (AxisMainTask, &taskParams, NULL);

        Hwi_Params_init(&hwiParams);
        hwiFuncPointer = (Hwi_FuncPtr)TopZIsr;
        hwiParams.priority = 9;
        hwiParams.enableInt = FALSE;
        hwiTopZHndl = Hwi_create(96, hwiFuncPointer, &hwiParams, NULL); // 96 est le numéro d'it
        Hwi_enableInterrupt(96);

    The SYNC0 priority is 8 and this is the highest priority (the TopZIsr actually can't occur).

    So I think that no other ISR can interrupt my SYNC0 ISR and the jitter is not good at all !

    Is there something that I forgot ? Is there an ISR that interrupt my SYNC0 ISR ?

    Thanks,

    Laurence

  • Hi Laurence,

    first of all the tasks and HWI priorities are not related. HWI is a real ISR and the priorities are HW dependent but may be configurable.
    Tasks are scheduled by SW. Tasks can not interrupt a HWI.
    I assume there are more HWIs in your system but can't see them. You may use ROV again to get more details. Again I recommend UIA to get a view of what your processor is doing over time.

    On top of that from experience we know that task jitter in RTOS is already in the range of a few us. This depends on cache performance/settings.
    One thing to try would be to get all the critical ISRs and the OS functions related into one section. Hopefully this is small (<32k) and can be locked into one block of your L2 cache. That should have an impact on jitter as now the calling time is not affected by slower DDR accesses. As there are still 7 blocks of L2 cache for the rest it should not affect overall performance too much.
    Similarly you can try to place some code into internal SRAM that is otherwise unused.
    All of that is part of system optimizations that are case dependent. So we can only try to help...

    Best regards,
  • Sorry Frank, I made a bad manipulation !
    So, in my former message( you didn't have it )I told you that :
    - I have understand how the cache works: in fact, my cache is already enable and seems to be used in a good way ! I thing that my timing are already improved.
    - I made measures with UIA and ROV and I saw that there are 3 HWI Isr that can interrupt my sync0 Isr; specially the red one.
    - I saw that the priority of this HWI is very high (63)
    Can you explain me what are these HWI interrupt and if I can disable them or change their priority ?
    - I measure my sync0 cycle time in UIA and I found 89us !!!! I think this enormous cycle time is due to UIA analysis, Am I right ?

    Can you help me please ?
    Thanks a lot,
    Laurence
    PS: I have closed the post on cache
  • Hi Laurence,

    actually in AM335x INTC '0' is highest IRQ priority. However it also requires special setup for nested IRQs. I am not sure if that is enabled in your system. In the view you provide there are no issues with HWI as they seem to be pretty short.

    What seems to take really long is your Sync0Task(). This seems to take a lot of  CPU time until pre-empted. Maybe this has a while() and no task_yield() or task_sleep()?

    I also don't understand your measurements here. You should set the xN markers to begin and end of a task. Here it looks like you are measuring a cycle.

    For sure UIA is not the issue here as it is quite efficient and just takes short time stamps on begin and end of tasks or HIWs. The calculations are done later on the debug PC. Otherwise all your tasks would look like they take a long time. Of course there is a little bit of influence due to debug but that can't be avoided. You may later remove all debug and UIA code and then measure with HW signals only for final verification of timing.

    But first you should fix the issue with Sync0Task(). Either it needs too much computation power (increase the CPU clock...) or it just loops without releasing the CPU. That may be ok as long as it really is the lowest prio task here.

    Regards,

  • Hello Frank,

    First of all I would like to thank you for your help.

    I have worked a little with UIA and I have some results:

    1. In the timingsimple.jpg file, I have put a graph made with a simple program where no function for calculation is called in the Sync0_Isr().

    On this graph, we can see that the sync0 task is quite little (from 2 to 6 us): there is plenty of time left to do other things.

    We also see that, as I asked in my ethercat configuration, my sync0 has a cycle time close to 62us (62,5us), my sync1 500us and my PDI 500us. But we can also see a big jitter on sync0 when sync1 is called: 71us before and 53us after !

    Can you explain me why this jitter occurs ?

    2. In the timingcomplet.jpg file, I have put a graph made with a complex program where my real function for control motor is called in the Sync0_Isr().

    On this graph, we can see that the sync0 task is very big (from 35 to 42 us): there is a big problem of time remaining....

    I find the same results when I use an oscillloscope and TestPoints to visualize timing.

    Of course, I have made these graph in a debug mode. In a release mode my sync0 task is smaller: 16us max. But it is still an annoying subject for us.

    I would like to visualize CPU load to confirm this point of view but I have a problem: there is no graph drawn when I use it (cpuLoad.jpg file)

    Can you tell me How to use CPU Load ?

  • Hi Laurence,

    yes, I am trying to help but we are reaching an area where I can't help a lot anymore. This is a typical system optimization scenario. This requires full access to the system and giving good advice on the basis of a few screenshots is nearly impossible. Also it is outside of our support scope I believe.

    It seems you are at the edge of what the processor is able to perform (at least with current clocks and in debug mode). As such you may exhibit the normal SW jitter in a non-deterministic processing core. Here you will have dynamics like cache and so on.

    Usually motor control algorithms are computing intense but I guess if you compile that part with full optimization your system timing will improve. At some point of release configuration you may lose the UIA debug capability but that is to be assumed.

    Concerning the UIA load function I assume this is documented otherwise you will need to ask in the CCS forum. I haven't used this a lot.

    Best regards.

  • Hi,

        I met a question on my UIA when test time. But the time is wrong. I set the cycle time 62us in the twincat. It should be 62us for sys0task cycle time but in my UIA, it show me 125us in below pic. it look like double. Because when I set 50us in the twincat, the UIA show 100us (x1-x2) .  Do you have any idea?


    Thank you for your help