This thread has been locked.

If you have a related question, please click the "Ask a related question" button in the top right corner. The newly created question will be automatically linked to this question.

Clock Manager....also

Guru 15580 points
Other Parts Discussed in Thread: OMAP-L138, OMAPL138

I am using the Logic PD Experimenter with OMAP-L138 SOM. I am trying to determine how to interpret the value returned by CLK_gethtime. My DSP is running at 300MHz. The crystal oscillator is running at 24MHz. So what is the clock rate of Timer 1?

Here is the clock manager GUI:


The OMAP-L138 data sheet implies (vaguely) that the timer is driven by OSCIN (which I assume is 24MHz) cycle time x4. See below:

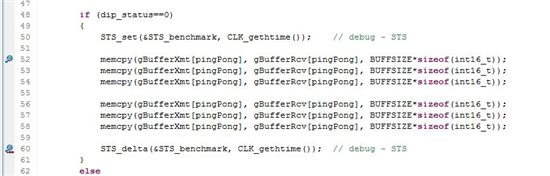
So this would lead me to believe the value returned by CLK_gethtime is;

value_returned=(1/24MHz)*4 = 167ns?

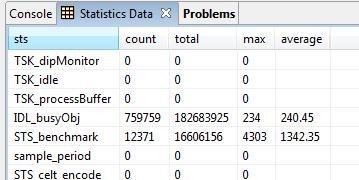
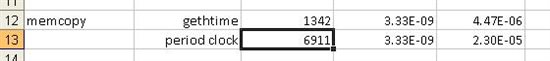
Is this correct? From other measurements I have made it appears to be closer to 6.7ns.

Can someone give me some guidance on this?

thx

MikeH


  • Hi Mike

    I am not sure where this is documented, but for For 64x+ and 674x core based devices , CLK_gethtime (high resolution timer) uses the TSCH/L registers which increment at the CPU clock rate.

    Details on TSCL/TSCH can be found in the CPU guide


    http://focus.ti.com/lit/ug/sprufe8b/sprufe8b.pdf  (Section 2.9.14)

    CLK_getltime (low resolution timer) makes use of one of the system timers, which is Timer 1 in OMAPL138 case

    Regards

    Mukul

  • Hi Mike,

    Can you specify what other measurements used?

    It could be possible that the other measurements had your clock source passing through internal PLLs which led to a different figure.

    Regards,

    Sid

  • Mukul,

    Thanks for the feedback, but I have been reading for a couple of hours now, and I am more confused than before about how CLK_gethtime() and the Period clock work and what their "tick" values are.

    As a test I measure the time consumed by a test algorithm (memcopy) using 1) Period clock, and 2) CLK_gethtime(). Here are the values for both tests:

    1) Period Clock = 1031 "ticks". if a "tick" is defined as (1/CPU clock) then the total time = (1/300MHz) * 1031 = ~3.4uSec

    2) CLK_gethtime() = 6,503"ticks". If a "tick" is defined as (1/CPU clock per this thread) then the total time =(1/300MHz) * 6,503 = 21.7uSec

    I measured the Period clock time by inserting a break point just before the algorithm, then single stepping over it.

    I measured the CLK_gethtime() using STS while running in real time.

    Which is the correct value?

    thx

    MIkeH


  • Sid,

    I am measuring the duration between EDMA3 transfers by inserting a  STS_delta(&sample_period, CLK_gethtime()) at the beginning of the callback routine called by the Tcc interrupt. The EDMA3 transfers 128 bytes of audio data from the McASP that is encoded at 48ks/Sec. This time value should be:

    (1/48ks/Sec) * 128 = 20.8uS * 128 = 2.67mSec.

    The value produced by the CLK_gethtime() function is 400,000 "ticks". If you take 2.67mSec/400,000 you get 6.67nSec per "tick", which is 2X the CPU clock rate of 300MHz.

    Am I doing something wrong?

    thx

    MikeH

  • Hi Mike

    Something is not right here

    MikeH said:
    1) Period Clock = 1031 "ticks". if a "tick" is defined as (1/CPU clock) then the total time = (1/300MHz) * 1031 = ~3.4uSec

    If you are talking about PRD ticks, each tick is typically 1 msec by default, I see that have not changed the default from the snapshot you have shown. The PRD tick is not 1/CPU clock

    MikeH said:
    I measured the Period clock time by inserting a break point just before the algorithm, then single stepping over it.

    What do you mean be single stepping here, I hope it did not imply single stepping through the memcpy routine, that will surely throw off the benchmarking numbers.

    MikeH said:
    I measured the CLK_gethtime() using STS while running in real time.

    I think you can also pass CLK_getltime() instead , can you try that and see if it matches your CLK_gethtime() values?

    I also recommend looking at this old appnote (even though it is not updated for c674x etc)

    http://focus.ti.com/lit/an/spra829/spra829.pdf

    you might find this post helpful too

    http://e2e.ti.com/support/dsp/tms320c6000_high_performance_dsps/f/112/t/11633.aspx

    I will point this forum post to BIOS folks to provide more debug inputs/ possible gotchas

    Regards

    Mukul

  • MikeH,

    I can tell you with certainty that CLK_gethtime() will return the TSCL value and that TSCL increments at a rate of CPU/1.  The counter mechanism is so incredibly simple that there is no way it can be wrong!  In case you don't believe me, here is the code as copied from clk.h62:

    CLK_gethtime    .macro 
            mvc TSCL, b4
            mv b4, a4
            .endm

    Yep, that's it!  Only 2 instructions!  It reads TSCL and returns it...

    You must have made a mistake somewhere else.  For example, in your audio calculations, you only have 8-bit data coming in?  Is it mono or stereo?  How is the FIFO threshold configured?  I imagine you're off by a factor of 2 on one of these things...

    Brad

  • MikeH,

    There are several sub-threads going here, so hopefully we can keep everything straight.

    Sid alluded to your input clock going through a PLL, and this is exactly what happens to get you to a 300MHz CPU clock. The CPU clock rate is what should be entered in the CLK - Clock Manager Properties dialog for the Input Frequency (MHz) parameter. So instead of 24.0000, this should be 300.0000. Changing this will change the PRD register value that is grayed-out near the bottom of that dialog. And this will change the CLK tick rate.

    MikeH said:
    The value produced by the CLK_gethtime() function is 400,000 "ticks". If you take 2.67mSec/400,000 you get 6.67nSec per "tick", which is 2X the CPU clock rate of 300MHz.

    Am I doing something wrong?

    The value returned from CLK_gethtime() is the number of CPU clock cycles, so if you know the CPU clock rate then this is a measurement of time. It may be a subtle distinction that still comes up with the same result that you have found, but dividing 2ms by 1.3us does not give you what you are looking for.

    If you want to figure out what the clock frequency is, use CLK_gethtime() to calibrate to the wall clock. Use something like

    code snippet said:
    volatile unsigned int uStart, uMeasure;
    uStart = CLK_gethtime();
    while ( 1 )
        uMeasure = CLK_gethtime();

    Run to a breakpoint at the uStart assignment, look at a wall clock with a seconds hand, click Run, wait 10 seconds, click Halt. Subtract uMeasure-uStart, divide by 10, and the result will be your clock frequency.

    With this confidence in the CLK_gethtime() value, you can figure out the time it takes to do things and try to figure out why the peripherals or functions take some amount of time by using CLK_gethtime() as a measure of time.

    RandyP

  • Gents,

    First of all, thanks for taking time to respond.

    Second, my bad. I meant to say "Period Clock" instead of PRD clock. I do understand the way PRD clock is generated. It's the Period Clock that has me confused.

    So let me boil it down to this:

    I have made a measurement using two different techniques (Period Clock and CLK_gethtime()). They give very different results (4.47uSec vs 23uSec). I am trying to figure out why the two are so different. Here is how I made the measurements.

    I created several dummy memcopy's.


    To measure CLK_gethtime I inserted an STS_ with a CLK_gethtime() just before, and just after the group of memcopys. The "benchmark" STS value is as follows (1342 ticks):

    After making the above measurement I inserted break points at the first memcopy and after the last memcopy. After restarting the program and running to the first breakpoint I enabled Period Clock. I then ran the program to the next break point just after the last memcopy. Here is the value of Period Clock (6911 ticks).

    If you calculate the time consumed by each method, the results are as follows:


    This assumes that the "tick" value for each measurement technique is 1/300MHz = 3.3nSec.

    So, my question is, why is Period Clock giving a measurement of 23uSec and gethtime() gives a measurement of 4.47uSec? Or, were am I going wrong?

    Thx

    MikeH

  • MikeH,

    Be careful with your usage of "tick".  Generally speaking when we talk about "ticks" we are talking about "kernel ticks".  This would be synonymous with the 1ms kernel interrupt and related to the return of CLK_getltime(), i.e. the low-res time not the high-res time.

    I have little confidence in the clock feature you are using from CCS.  Given your results I would say that BIOS is right and CCS is wrong.  I'm having trouble finding the documentation for that CCS clock feature, but as I recall there is some delay from the time you hit the breakpoint until the clock actually stops counting.  So in order to get a more accurate measurement you need to setup 3 breakpoints, we'll call them A, B, and C.  In order to measure A->B you need to take the A->C  measurement and then subtract the B->C measurement.  If you do something like that I imagine it will be closer.  To be honest, I'm not even sure what time base that one uses or anything.  I would just stick to CLK_gethtime and forget the CCS profiler clock...

    Brad

  • MikeH said:
    I meant to say "Period Clock" instead of PRD clock.

    Maybe you meant to say Profiler Clock? I do not find a reference to "Period Clock" anywhere and your picture looks like the Profiler's clock.

    MikeH said:
    I have made a measurement using two different techniques (Period Clock and CLK_gethtime()). They give very different results (4.47uSec vs 23uSec). I am trying to figure out why the two are so different.

    Here in the C6000 Forum, we can tell you that the hardware-based TSCL counter used by CLK_gethtime() is very accurate and reliable. Have  you calibrated it to confirm its rate using a method like the one I mentioned earlier? If not, please do that so we can at least know the system is behaving the way you believe it is.

    If you want to understand details about the Profiler Clock, that is a CCS issue that would need someone from that group to address. Although Mukul or Brad may know more about it than I do. I usually use it only in the simulator, mainly because I know the TSCL and use it for my benchmarking so I can get my results in code rather than by reading the screen.

    Do you get different results with the Profiler Clock when you repeat the loop around the memcpy's? The STS_benchmark shows a lot of passes with at least one large number and many smaller numbers. Remember that you would need to clear the Profiler Clock at the first breakpoint each time. I think you can clear it by double-clicking on it.

    MikeH said:
    So, my question is, why is Period Clock giving a measurement of 23uSec and gethtime() gives a measurement of 4.47uSec? Or, were am I going wrong?

    It is pretty hard to figure out where you are going wrong from what we can see here, although you have done an excellent job of using the pictures to make things much more clear. Thank you for that.

    There is no counter that can be running faster than TSCL, so the only simple reasons I can think of why the Profiler Clock would be 5x TSCL's value are 1) overhead or 2) you did not clear the Profiler Clock and it is a running value.

    One thing you could try that would give you some idea of the differences: record a series of measurements with each method, then add another memcpy and record a series of measurements, then add another memcpy and record a series of measurements. The differences will eliminate overhead and let you compare the incremental counting nature of the two methods.

  • Gents,

    ARRRGGHH....my bad...again. I *do* mean Profiler Clock. Sorry.

    "If you want to understand details about the Profiler Clock, that is a CCS issue that would need someone from that group to address."

    The initial information I received from Rafael in this thread was that the Profiler Clock ran at the CPU rate. So this was the basis for my Profiler Clock assumptions.

    "Do you get different results with the Profiler Clock when you repeat the loop around the memcpy's? The STS_benchmark shows a lot of passes with at least one large number and many smaller numbers. Remember that you would need to clear the Profiler Clock at the first breakpoint each time. I think you can clear it by double-clicking on it."

    Yes, I repeat the loop several times and zero the clock before restarting the memcpys so that I get a consistent reading.

    I agree that the TSCL counter is a much better way to make these measurements, but unfortunately, my algorithm is taking so much time to run that the program will not run under BIOS and no statistics are gathered. That's why I need to "step over" the algorithm using Profiler Clock to get any measurement. Obsiously, I need to figure out how to shorten the computation time of the algorithm, but I needed some way to get even a rough measurment of its performance before I start picking it apart. It doesn't look like I will be able to use STS and gethtime to make this measurement.

    I guess at this point I will use the TSCL as the "calibration" for my Profiler clock and do some additional sanity checks to make sure things appear to be rational.

    thx

    MikeH

  • MikeH,

    TSCL does not require BIOS. There is a good Wiki article here that has an example of how to use TSCL without any BIOS.

    I prefer using the 64-bit version which can be done easily with code such as this (can fail if an interrupt's ISR might read TSCL between the TSCL and TSCH reads in _itoll):

    example main.c said:
    #include <c6x.h>

    void main()
    {
        volatile unsigned long long ullTimer1, ullTimer2;
       
        TSCL = 0;
       
        ullTimer1 = _itoll( TSCH, TSCL );
       
        while (1)
             ullTimer2 = _itoll( TSCH, TSCL );
    }

    You can use this main.c as-is to measure your CPU clock speed. I use this sometimes when I am not sure if I have set the PLL correctly. Run to the ullTimer1 assignment, then watch the clock and run for 10 seconds and compare the numbers to figure out the clock speed.

    The _itoll() intrinsic seems to read TSCL first, with both the Debug and Release configurations. If it reads them in the opposite order, then this would not work.

    Sometimes I will allocate an array of unsigned long longs and read TSCL/H several places in the code, incrementing an index in the array for saving the next timer values. This is pretty low overhead for getting accurate benchmark times.

  • Hi,


    My 2 cents on Profiler clock, on simulators. On simulators, the profiler-clock can be configured to count one of the several 'events'. For example, it can be configured to count one of the following list (the list is representative only and not complete. Click on Target->Clock->Setup to view the entire list)

    1. cycle.CPU -- CPU Clock

    2. cycle.Total -- Device clock (should be same as TSCH/L)

    3 .Cache stats (like hits, misses, data/prog, victim, snoop etc)


    Please ensure that the Profile-clock you used is indeed configured to count the cycle.Total. Otherwise the TSCH/L clock and profiler-clock will not match.


    Regards,

    Nizam


  • All,

    Again, thanks for the help. I have finally figured out how these various clocks work. I continue to place the blame for much of my confusion on TI's horribly jumbled and confusing documentation.

    My fundamental mistake was somehow thinking gethtime() and getltime() were directly related and used the same hardware timer. I also never heard of TSCL/TSCH until they were metioned in this thread. I went back to the OMAP-L138 data sheet and the C6748 data sheet, which I have read numerous times, and never saw them mentioned. There were vague references to various time stamp counters, but no explanation of what they are and how they work.

    Also, explanations from the BIOS User Guide like this:

    "On the C6000 platform, the 32-bit high-resolution time is calculated by multiplying the low-resolution time (that is, the interrupt count) by the value of the period egister and adding the current value of the timer counter register. To obtain the value of the high-resolution time you can call CLK_gethtime from your application code. The value of both clock restart at 0 when the maximum 32-bit value is reached."

    ...tend to confuse me even more. No where in the BIOS User Guide does it specifically say, "gethtime is derived from the Time Stamp Counter which is driven by the DSP CPU clock".....unless I missed it.

    I've given up on the Profile Clock since it seems to be targeted for emulation and seems to be hit or miss in accuracy.

    Again, thanks for your help.

    MikeH

  • MikeH,

    I will forward your comments to the BIOS documentation team. The BIOS User Guide tries to be accurate across several DSP platforms, and it ends up being less helpful in cases like this.

    The BIOS API Reference Guide spru403q does discuss the high-resolution timer to a bit more detail in section 2.5 CLK Module. On page 2-55 (85 of 644) Table 2-2 hints that there is a different counter for the C64x+, but does not go into the implementation detail since it is trying to abstract that hardware for use by the programmer.

    In C6000 devices before the C64x+, gethtime and getltime were more directly related, as you were expecting.

    All of this is agreeing with you that the documentation is lacking. Sometimes you have to know the answer to be able to find the answer, and that is not a good way to organize the information.

    If you are not finished with this thread, we will discuss whatever you still need to understand. If you are finished and if one of the posts comes close to answering your question(s), please click Verify Answer on that post - your post above may be the appropriate one, or one of the ones from us.

    RandyP

  • Randy,

    Thanks for the feedback. I appreciate your sending my comments along. Also, I have marked 3 posts as answers since they did answer several of my various questions.

    Just for clarification, I am using the OMAP-L138, which contains a C6748 DSP. Apparently the documentation is even further behind for this particular chip.

    I had read the BIOS API Ref Guide, several times while scratching my head over comments such as the ones you pointed out in table 2.2

    I even scanned the OMAP-L138 & C6748 data sheets for the term "CLKOUT" and could not find it mentioned except as part of VP_CLKOUT, which is totally unrelated. I am now assuming that it must pertain only to the C64+ platform.

    As you can tell, the documentation (or lack thereof) is probably creating 90% of the traffic on this E2E forum, which obviously keeps a lot of you very talented guys/gals very busy on things that should/could be answered by "RFTM". I certainly hope the powers-that-be at TI are aware of this issue and are working feverishly to correct it. Otherwise, you all have a tremendous amount of job security....:)

    Again, thansk for taking the time to dig into my mis-understandings.

    MikeH

  • MikeH,

    FYI, the latest version of BIOS has corrected this issue.  Here is the new Table 2-2 which is much improved:

    Now at least it mentions TSCL by name and even if you don't know what it is, you at least have something precise to search for!

    Best regards,

    Brad

  • Thanks for the update Brad. This is certainly a step in the right direction.

    MikeH