This thread has been locked.

If you have a related question, please click the "Ask a related question" button in the top right corner. The newly created question will be automatically linked to this question.

Linux: How to use valgrind in with psdk3.0

Tool/software: Linux

We find a mem leak problem in our application.

Since we can not locate it, we decide to use valgrind to locate where the leak is.

We have successfully compiled valgrind in our platform, but when the application runs, error come out

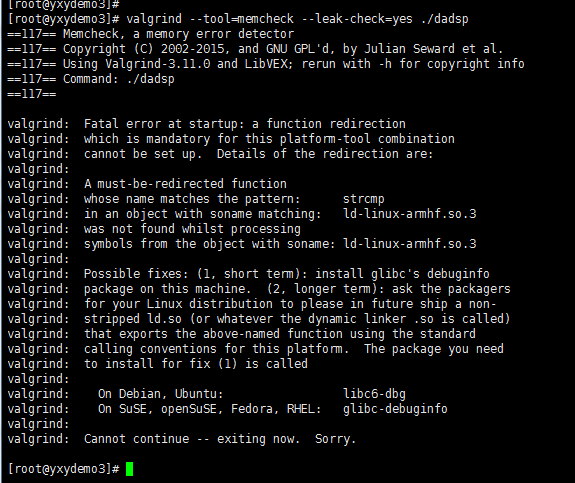
It seems that the glibc debuginfo is not found.

-----------------------

So how to use valgrind in psdk3.0

Or Is there any other way to detect mem leak?

  • Hi,

    I would like to do some experiments on the latest PSDKLA 3.04 before answering the question, can you please confirm if you are on PSDKLA 3.04?

    Regards

    Karthik

  • I check the version and found it is psdk 3.2.0.4 

  • How about the current progress now

  • Hi,

    I have made some simple tests on the valgrind with the PSDKLA 3.04 release filesystem.

    First test:

    a. Simple hello world print program and then run this output through the valgrind with the command that looks like below.
    valgrind --leak-check=full --track-fds=yes --leak-resolution=high ./helloworld

    This reports no leaks.

    b. Hello world program with a memory leak:

    root@dra7xx-evm:~# valgrind --leak-check=full --track-origins=yes --track-fds=yes --leak-resolution=high ./hello
    ==1254== Memcheck, a memory error detector
    ==1254== Copyright (C) 2002-2015, and GNU GPL'd, by Julian Seward et al.
    ==1254== Using Valgrind-3.11.0 and LibVEX; rerun with -h for copyright info
    ==1254== Command: ./hello
    ==1254==
    hello world
    temp[0] = 1234==1254==
    ==1254== FILE DESCRIPTORS: 3 open at exit.
    ==1254== Open file descriptor 2: /dev/ttyS0
    ==1254== <inherited from parent>
    ==1254==
    ==1254== Open file descriptor 1: /dev/ttyS0
    ==1254== <inherited from parent>
    ==1254==
    ==1254== Open file descriptor 0: /dev/ttyS0
    ==1254== <inherited from parent>
    ==1254==
    ==1254==
    ==1254== HEAP SUMMARY:
    ==1254== in use at exit: 100 bytes in 1 blocks
    ==1254== total heap usage: 1 allocs, 0 frees, 100 bytes allocated
    ==1254==
    ==1254== 100 bytes in 1 blocks are definitely lost in loss record 1 of 1
    ==1254== at 0x483D764: malloc (in /usr/lib/valgrind/vgpreload_memcheck-arm-linux.so)
    ==1254==
    ==1254== LEAK SUMMARY:
    ==1254== definitely lost: 100 bytes in 1 blocks
    ==1254== indirectly lost: 0 bytes in 0 blocks
    ==1254== possibly lost: 0 bytes in 0 blocks
    ==1254== still reachable: 0 bytes in 0 blocks
    ==1254== suppressed: 0 bytes in 0 blocks
    ==1254==
    ==1254== For counts of detected and suppressed errors, rerun with: -v
    ==1254== ERROR SUMMARY: 1 errors from 1 contexts (suppressed: 0 from 0)


    c. More complex application that creates some leaks periodically
    ==1263== HEAP SUMMARY:
    ==1263== in use at exit: 10,552 bytes in 90 blocks
    ==1263== total heap usage: 3,320 allocs, 3,230 frees, 4,880,514 bytes allocated
    ==1263==
    ==1263== 156 (144 direct, 12 indirect) bytes in 4 blocks are definitely lost in loss record 2 of 4
    ==1263== at 0x483FD04: calloc (in /usr/lib/valgrind/vgpreload_memcheck-arm-linux.so)
    ==1263==
    ==1263== 8,300 bytes in 83 blocks are definitely lost in loss record 4 of 4
    ==1263== at 0x483D764: malloc (in /usr/lib/valgrind/vgpreload_memcheck-arm-linux.so)
    ==1263==
    ==1263== LEAK SUMMARY:
    ==1263== definitely lost: 8,444 bytes in 87 blocks
    ==1263== indirectly lost: 12 bytes in 1 blocks
    ==1263== possibly lost: 0 bytes in 0 blocks
    ==1263== still reachable: 2,096 bytes in 2 blocks
    ==1263== suppressed: 0 bytes in 0 blocks
    ==1263== Reachable blocks (those to which a pointer was found) are not shown.
    ==1263== To see them, rerun with: --leak-check=full --show-leak-kinds=all
    ==1263==
    ==1263== For counts of detected and suppressed errors, rerun with: -v
    ==1263== ERROR SUMMARY: 157692 errors from 398 contexts (suppressed: 0 from 0)


    So the valgrind as such is working fine. Please check further on your side with the application that you are interested in.

    Regards
    Karthik