This thread has been locked.

If you have a related question, please click the "Ask a related question" button in the top right corner. The newly created question will be automatically linked to this question.

RTOS/66AK2H12: Identify preempting or blocking task

Part Number: 66AK2H12
Other Parts Discussed in Thread: SYSBIOS

Tool/software: TI-RTOS

XDCtools 3.32, SYS/BIOS 6.46, CCS 7.4, PDK 4.0.7, NDK 2.25

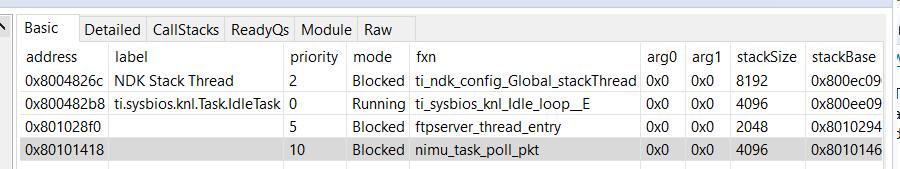
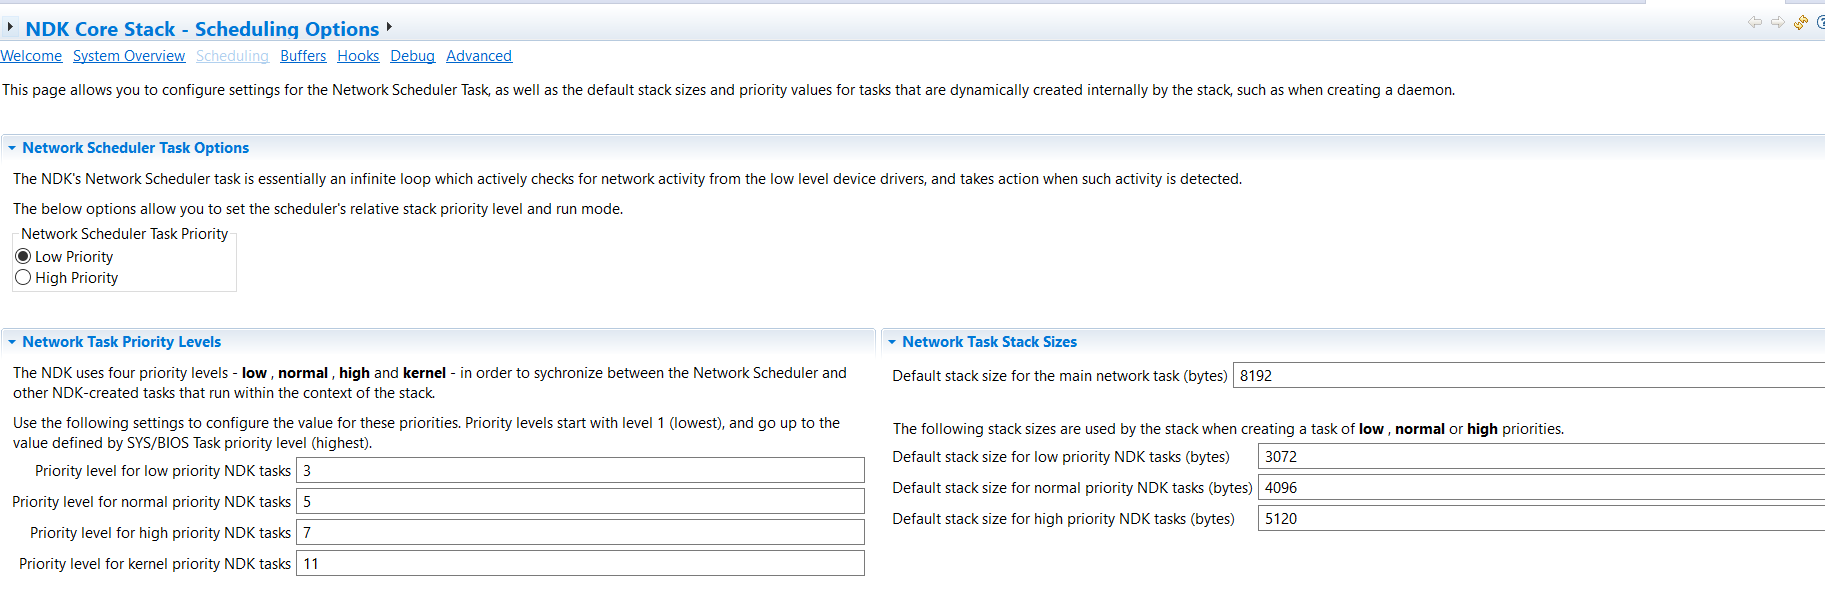
I have an ARM application with a bunch of tasks. One of the tasks is responsible for receiving TCP data from a connected client and processing this data as 'commands'. I seem to have an issue in which this receiving task (priority 7) is getting preempted or blocked while the NDK continues to receive and buffer data from the attached client. The NDK is running at priority 12. The other tasks on the ARM are running at various priorities but all below the NDK and for the most part at or above the server receiving task. 

I believe the receiver is blocked temporarily because after a short time (several seconds), I get a burst of messages over the stream from the network buffer that I am unable to process in a timely fashion. The data from the client is relatively small (<300bytes) and infrequent (5/sec).

I am having a hard time identifying what is blocking the receiver. I'm assuming that it is one of my other tasks. I don't know the situation is occurring until it has cleared and I get prints that I am unable to process this burst of incoming data.

I am looking for debugging tips or hints. Is there a way to problematically recorded the last thing that blocked or preempted a task so that once I identify the problem has occurred I can display that collected info? (I do not have access to the CCS debugger but have a flash log that I can log to and can send debug message out a udp port). 

Mike

  • Hi,

    It looks that you have:

    NDK task at 12 (the highest)

    some other tasks (7-11)

    server receiving tasks (7, the lowest)

    idle (0)

    I don't know what is the NDK task, is it the packet polling from EMAC driver? I take a look of our NDK example on other processors, using CCS ROV view:

    The NIMU driver has to have the highest task priority. You may increase your receiver task priority higher. Will this help?

    Also, in the .cfg file when you create the CCS project, if you open it with XGCONF tool, under scheduling:

    You may check NDK user guide to see how to set this up.

    It is good you have the CCS/JTAG to debug the application before it integrated into a product, you can use some CCS tool, like ROV view to debug this.

    Regards, Eric

  • Hi Eric.

    I have the NIMU and network stack at the highest priority thanks to your help and others here. I do not believe it is NIMU or part of the NDK that is preempted. I think one of the other tasks on the arm or a mailbox, event or some other blocking calls has the my received task blocked.

    I can open the unit and connect to debug under CCS. The problem is not readily repeatable and when it does manifest I don't know until after the fact when I see warning messages produced. So I can't Pause execution during the problem nor set a break point before the event happens. So I was looking for debugging hints on how I could record what had the task blocked so that pausing post event occurrence on a brake point would allow me to determine what had the task blocked or preempted.

    Thank you for pondering my question and offering suggestions.
  • Mike,

    I asked my SYSBIOS colleague to help.

    Regards, Eric
  • Hi Mike,

    To help me understand, how are the warning messages generated? If they are coming from the target device, then maybe you can halt the processor when it prints out the warnings. In which case you can leverage a tool such as the Execution Graph in the System Analyzer. The System Analyzer User Guide in <PDK installation dir>\uia_2_00_06_52\docs\spruh43f.pdf, section 4.8 describes it. It allows you to see the threads that ran on a timeline, immediately prior to the processor being halted. You may wish to look into setting it up to give you visibility into your execution details. The graph leverages a logging mechanism implemented in UIA that gives you details on past Task switches, Interrupts, etc.. Section 5 describes how to configure the UIA LoggingSetup module in your .cfg file to log the execution details.

    If it is not possible to halt the CPU automatically after the situation occurs, maybe you can increase the buffer sizes in the UIA LoggingSetup configuration so that it captures a long history. This way when you manually halt the execution after seeing the warning messages, you have a better chance of capturing the problem in the log buffer.

    In general, in this type of problems, it is best to simplify your use case. See if the problem can be reproduced with fewer Tasks running by temporarily disabling the ones that are not involved in receiving data, and/or perhaps see if it helps to have your receiving Task bumped up to priority 11, so that no Tasks other than the NIMU and NDK related ones are higher to rule out other Tasks preempting your receiving Task. Based on your findings you can reintroduce the other Tasks one or more at a time to find the culprit. Also, if the target code is printing out status messages to the UART (not sure if this is the case), this could result in additional interrupts and processing that impact the execution. In which case it may be interesting to silence these and see if the problem still occurs.

    Best regards,
    Vincent
  • Thanks both for chiming in.

    The messages are generate after the problem has occurred and cleared. The messages are a result of a now pending back log of data from the connected client (another EVM). These debug messages are both logged to a flash logger on the server EVM and sent via UPD broadcast to listeners (e.g. a PC on the same network).

    Is there a way to log, using the UIA logger or other mechanism, what is preempting a task? Or what it is pending on? If I could generate such a log,then post event I could halt on a breakpoint and view the Logger under ROV.

    Very shortly, the device will be buttoned up and I will no longer have a chance to access with CCS. Is there a way to access the Logger records problematically? If I can read them from the ARM0 I can get them via our TCP connection.

    Mike

  • Hi Mike,

    Thanks for the clarification. The UIA logging mechanism (and the Execution Graph by extension, which is just a rendering of the log data) has the ability to log system events. The Execution Graph will show you the transitions between Tasks/Hwis/Swis over time. So if a Task is preempted by another Task or an interrupt you will see the transition on the graph. It would also show any Semaphore_pend and post calls if you set "LoggingSetup.sysbiosSemaphoreLogging = true;" in your .cfg file. to log Semaphore events. I think between the graph and the log itself you should be able to find what you need. The log data is automatically analyzed and rendered after the CPU is halted when the logger is operating in stop mode.

    Note that the UIA log is viewed under the RTOS Analyzer, not ROV, which is a different tool.

    If you do not have a JTAG connection, there is in theory a way to route the UIA log to the a transport of your choice by setting the logger type to LoggerIdle. This would call a custom function of your choice when the idle Task is run to send the log data via the mechanism you wish to use, and give you maximum flexibility. There is some work to do to implement such a transport however, so having JTAG would be a lot more convenient. Here is an example of where the UART is used in case you are interested: processors.wiki.ti.com/.../LoggerIdle_Uart.

    Given you are having an issue with your Ethernet connection, you should be careful about using the same link to shuttle the log data, to avoid impacting the real-time behavior that you are trying to observe.

    Best regards,
    Vincent