This thread has been locked.

If you have a related question, please click the "Ask a related question" button in the top right corner. The newly created question will be automatically linked to this question.

Linux/TMDSEVM572X: How to analysis the timestamps graph generated by TIDL Execution Graph viewer

Part Number: TMDSEVM572X

Tool/software: Linux

Hi,

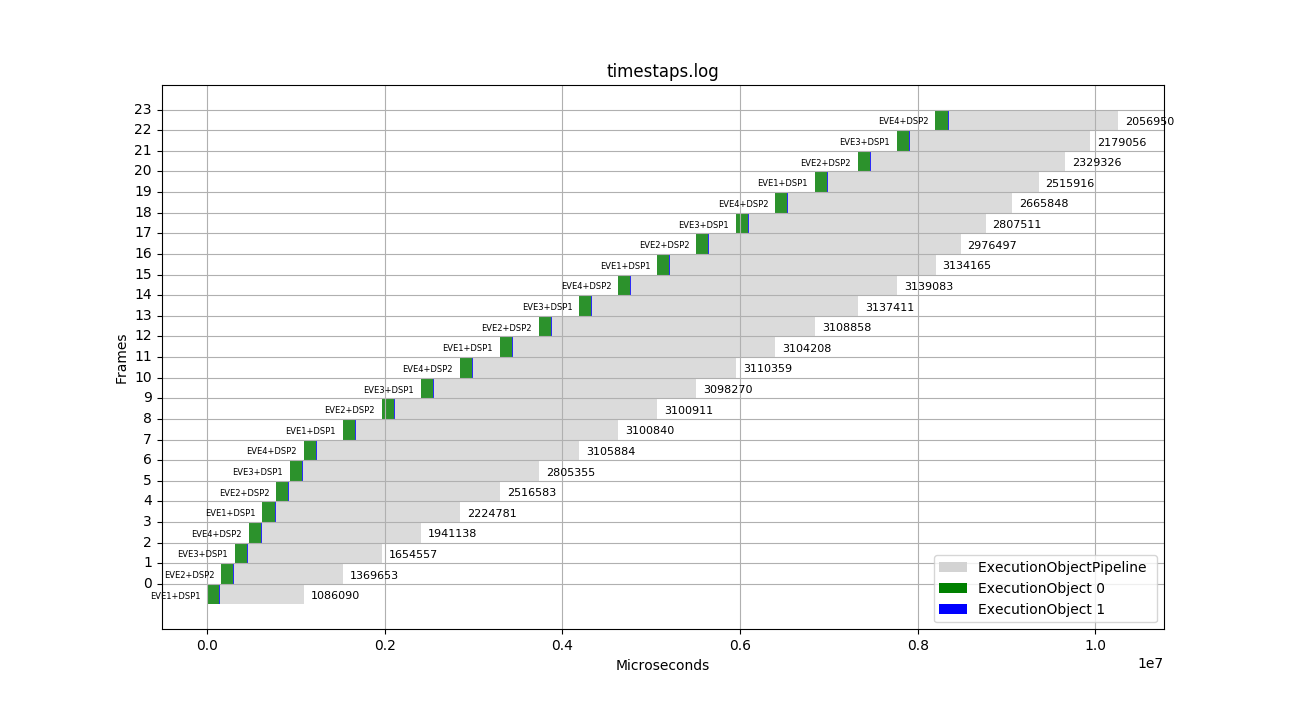
    I have run a TIDL application on TMDSEVM572X with 2 DSPs and 4EVEs, and get a timestamp graph as follow, but I don't know what the exact meaning of the blocks of diffrent color despite  the labels in lower right . Are there any instructions to analysis the timestamp graph?

    Regards,