This thread has been locked.

If you have a related question, please click the "Ask a related question" button in the top right corner. The newly created question will be automatically linked to this question.

RTOS/PROCESSOR-SDK-AM335X: EtherCAT communication latency - "loopback test"

Part Number: PROCESSOR-SDK-AM335X
Other Parts Discussed in Thread: AM3357, AM3359

Tool/software: TI-RTOS

Hello,

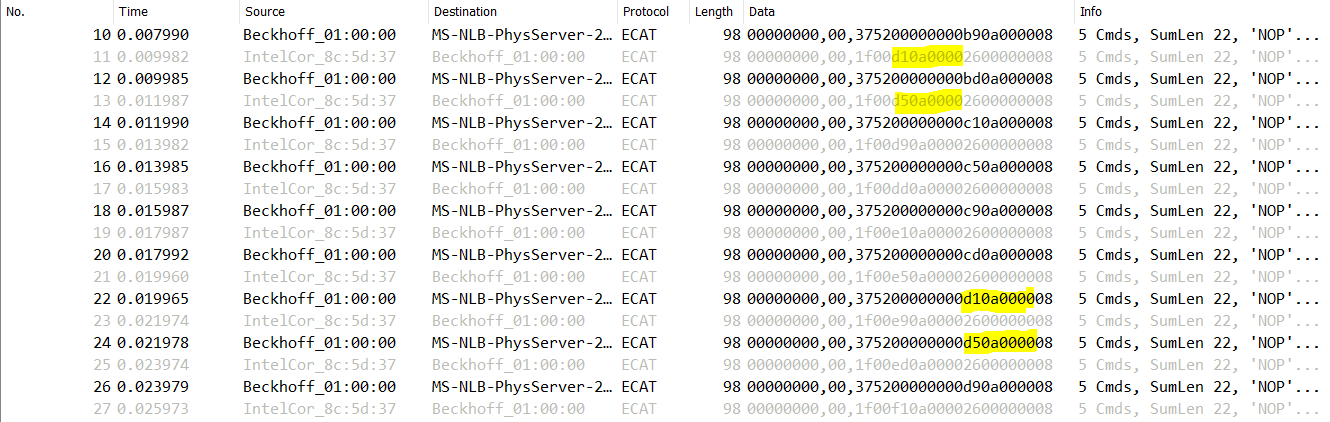
We are working with sitara AM3357 device and we use the EtherCAT stack (TI-RTOS) to implement and EtherCAT slave. Right know we are measuring the time between the transmission of a register sent by the master through a PDO (master to slave), this value is copied into another slave register PDO (slave to master) and we wait until this value is received by the master again. It is some kind of loop-back test. We have repeated the same test using different EtherCAT cycle times (from 500 us to 2 ms) and what we see is this:

Value sent by the master Value sent by the slave 
1 0
2 0
3 0
4 0
5 0
6 1
7 2
8 3
9 4

So it looks like there is a latency of 5 cycles independently of the cycle time of the network (for a cycle time of 2 ms the delay is about 10 ms, whereas for a cycle time of 500 us, the delay is around 2.5 ms). However, every message is processed, so that means that data arrives to the PRUSS before a network cycle.

I was looking for information about this latency to see if there is a way to decrease it or at least to understand why it is happening, but all the information about latencies I found are related to propagation. 

Could you please help me about this topic? why this delay exists? is there a way to decrease it?

  • Hi,

    Which EtherCAT master are you using? PLC or open source?
    And how do you measure the latency on two devices? Do you have a GPIO pin toggling like mechanism to get the latency of a PDO data transfer?

    Regards,
    Garrett
  • Hi,

    I'm using TwinCAT in run mode with DC enabled and I'm monitoring the frames using wireshark. And yes, we have a GPIO toggling like mechanism, but using more bits. The master writes the register outputs and increases it by one on every cycle. This value is copied inside the sitara in a input register.

    See what we are seeing on wireshark, I think it is easier to understand:

    The grey rows belong to the data that goes from master to slave. Black rows belong to data that goes from slave to master. As you can see data is correctly copied on every ethercat bus cycle but the transmission to the slave is delayed 5 cycles. In this example the ethercat bus rate is 2 ms. If I set the cycle to 0.5 ms instead, the number of cycles are exactly the same. So it looks like it is not a timing issue.

    Thank you,

  • Hi,

    Can you try to use PLC to ensure timing consistency for the measurement? Also using process data memory instead of register, we don't see such big latency cycles.

    Regards,
    Garrett
  • Hi,

    I'm sure the issue is not from the master because we are doing the exactly same test with other Ethercat Slave Controllers and we are seeing better results than the implementation on Sitara AM3357. We are already using process data, the "registers" are mapped there. 

    Could you share how are you executing the test? How many cycles of latency do you see in your test?

    We would like to understand how sitara is managing the data to see if we could improve this somehow.

  • We use frame timestamp to calculate the latency. Below is our test procedure and result:

    1) We have three PDOs,

    a. Master_timestamp -> Current timestamp of PLC. Sent from PLC to slave with every frame

    b. Slave_timestamp -> Current timestamp of Slave. Sent from Slave to PLC with every frame

    c. Master_to_Slave_delay -> Slave reads the master_timestamp variable in application and writes back (Slave_timestamp – Master_timestamp) value. This gives the delay from Master to Slave. Sent from Slave to PLC with every frame.

    2) A task runs in PLC every cycle which checks the maximum values of

    a. Master_to_Slave_delay

    b. (Master_current_timestamp – Slave_timestamp)

    i. This is the Slave_to_Master_delay

    This is all assuming the Slave is running in DC mode. And readings we get for 1ms cycle time is

    1) PLC to Slave -> ~0.3 cycle

    2) Slave to PLC -> ~1.7 cycles

    Regards, Garrett

  • Hi,

    Thank you for sharing the information. So this means we could do something to improve our results and this is great, I have some additional questions:

    • Where is the timestamp computed in the slave? inside PRUSS or in the Cortex-A?
    • Are you using the SSC slave code for this test?

    Regards,

  • Hi,

    Timestamp info is from IEP of PRUSS. And Master_to_Slave_delay (Slave reads the master_timestamp variable and writes back (Slave_timestamp – Master_timestamp)) value is in application.

    Yes, we use SSC slave code for the test.

    Regards,
    Garrett
  • Hi,

    Ok, the test is very similar so I don't understand where this additional cycles are added. I'm waiting for the results of other tests to see if we could clarify something. Another question:

    1. We are using PRU-ICSS-EtherCAT_Slave_01.00.05.00 which is not the last one. Is there improvements regarding latency on the last releases?
    2. What version are you using in your test?
    3. And what board, ICEV2AM3379 maybe?

    Thank you

  • Hi,

    1. There is no specific latency update in recent releases.
    2. We have latency test for every release.
    3. it's AM3359 ICEv2.

    Regards,
    Garrett
  • Hi

    On our last test we have been able to reproduce similar results than yours (2 cycles on wireshark but at 2ms ). So good news. My last question about this topics:

    • If you increase/decrease the cycle time of the EtherCAT network to for example 500 us or 2 ms in your test, what results you obtain in cycles?

    Thank you

  • Hi

    I checked internally that we don't really have the latency data set with cycle time 500us or 2ms, but we think it should be close to ~0.3 cycle/~1.7 cycle as well.

    Regards,
    Garrett