Because of the Thanksgiving holiday in the U.S., TI E2E™ design support forum responses may be delayed from November 25 through December 2. Thank you for your patience.

This thread has been locked.

If you have a related question, please click the "Ask a related question" button in the top right corner. The newly created question will be automatically linked to this question.

Linux/AM5728: Benchmarks for power estimation

Part Number: AM5728

Tool/software: Linux

Hello,

I am using TI AM572x EVM board. I see that for power estimation TI uses Dhrystone benchmark. This is a considerably long benchmark. My question is, if I use extremely small applications which are run for a second or half a second or even less, would there be any variation (and by how much) in the power measurement. Is there any strong motivation not to use small benchmarks. I am afraid of some of the artifacts induced by the operating system into my power measurements. I am running these applications on top of Linux (not on bare metal). I am measuring the power consumption of the MPU subsystem by connecting an external power gauge across APM sense resistor R34.

Thank you for your time.

  • Hello again,

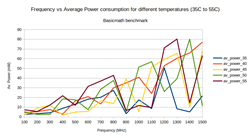
    I ran some small applications which do not stress the CPU much on the EVM. I wanted to know how the power consumption changes with the change the temperature. So, I am keeping the ambient temperature constant (with the help of a temperature control chamber) and measuring the power consumption for different frequencies. My expectation is that the power increases with the increase in frequency. It also increases with the increase in temperature. But my results show that although the trend is linearly increasing, it is all over the place. The plot can be seen in the figure below. All the other applications also show the same trend.

    My script runs like below

    1) Change the governor to usermode. Use taskset to pin the application for a certain core. The other core is also idle.

    2) set target frequency

    3) run the application

    4) Sleep for 2 minutes (so that any increase in ambient temperature due to the benchmark run subsides)

    5) go to 1

    I am assuming that the since the benchmark is small and does not stress the CPU, during the "Sleep for 2 min" (in my above script), the operating system places the process in the queue and when it is time to wake it up there might be some remnants of operating system tasks which are running in some cases. Is that a proper hunch? Could you please help me understand the plot better?

  • likely linux tasks dominated power while waking up. but before we go there, Could you explain how to the external power gauge measures power? i.e., does it just report instantaneous peak power, or measures the total energy used during the benchmark routine was running, then average over the time it took? noted that the kernel will run multiple timers shorter at higher frequency, thus linux tasks may have a different impact due to accessing to system components during wakeup.
    regards
    jian
  • Hello Jian,

    I use a compact data acquisition device from National Instruments (NI cDAQ-9174) for our data acquisition needs. I use the cDAQ along with a voltage module (NI 9215). I use the voltage module to measure the voltage drop across the sense resistor. I then calculate the current using Ohm’s law and multiply it with common-mode voltage to get power values. Depending on the sampling rate, I continuously acquire the instantaneous power values for the entire run of the benchmark. I then calculate the average of those power values, which is depicted in the plot above.

    Thank you for your time.
  • so it is average power. were you able to verify what happens if you loop the benchmark kernel multiple times? if the context switch takes dominate, then we shall get different curves.
    Jian
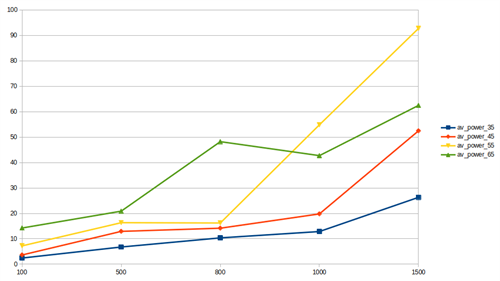
  • I tried to loop basicmath benchmark for 10 times. Did not run for all the temperatures or for all frequencies. It looks slightly better than earlier. May be I have to loop for more times. What do you think?

    Also, do you know of any other ways I can reduce some of the kernel tasks? Currently I am killing Matrix gui before I start my benchmark run. 

  • It now makes more sense to me, as the anomalies happen to 65C at 1GHz and above. In fact, since you are measuring average power for the duration of the execution, it may be worth to do one more experiment, where you just take the 1GHz@65C data point, measure avg power for 10x, 100x, and may be 1000x loop, and see if you get a constant value. This is really a spot check, as the internal CPU spot temperature may already rose though the thermalsteam tries to maintain a constant temperature from external.

    The PET shall give a good guidance on power changes vs. temperature. You can plug in the same load condition, just change the temperature, then see how much difference of power between 65C vs. 55C. These data were well correlated with Silicon process when the PET was validated.

    On the kernel tasks, have you tried to use kernel config, remove anything you don't need, and rebuild the kernel? If you need more details in this front, I may link you up with one of our team member.

    Regards
    Jian