This thread has been locked.

If you have a related question, please click the "Ask a related question" button in the top right corner. The newly created question will be automatically linked to this question.

Linux/TDA2P-ACD: Hardware Trace Debugging does not work when Linux is running

Part Number: TDA2P-ACD

Tool/software: Linux

Hi,

I am trying to use the Spectrum Digital XDS560v2 Pro Trace on the TDA2P system to get a function trace of the DSPs.

My first test was:
1. connect the debugger
2. Power Up the device
3. Lauch the Target Configuration in CCS (default configuration that was generated by CCS with 'JTAG TCLK Frequency' set to 'TCLK looped back...')
4. Connect to A15_0
5. Use Script -> TDA2P MULTICORE Initialization -> DSP1SSClkEnable_API to enable DSP 1
6. Connect to DSP1
7. Load program (only main loop with timer polling)

This all worked without problems.


Our development hardware has Linux running on the A15 cores and a bare metal system running on both IPUs and DSPs.
Linux will load the bare metal cores using remoteproc.

When trying to get a function trace on the DSP I tried the following steps:

1. connect the debugger
2. Power Up the device, Linux will boot and start the bare metal system
3. Lauch the Target Configuration in CCS (default configuration that was generated by CCS with 'JTAG TCLK Frequency' set to 'TCLK looped back...')
4. Connect to DSP1
5. Load symbols

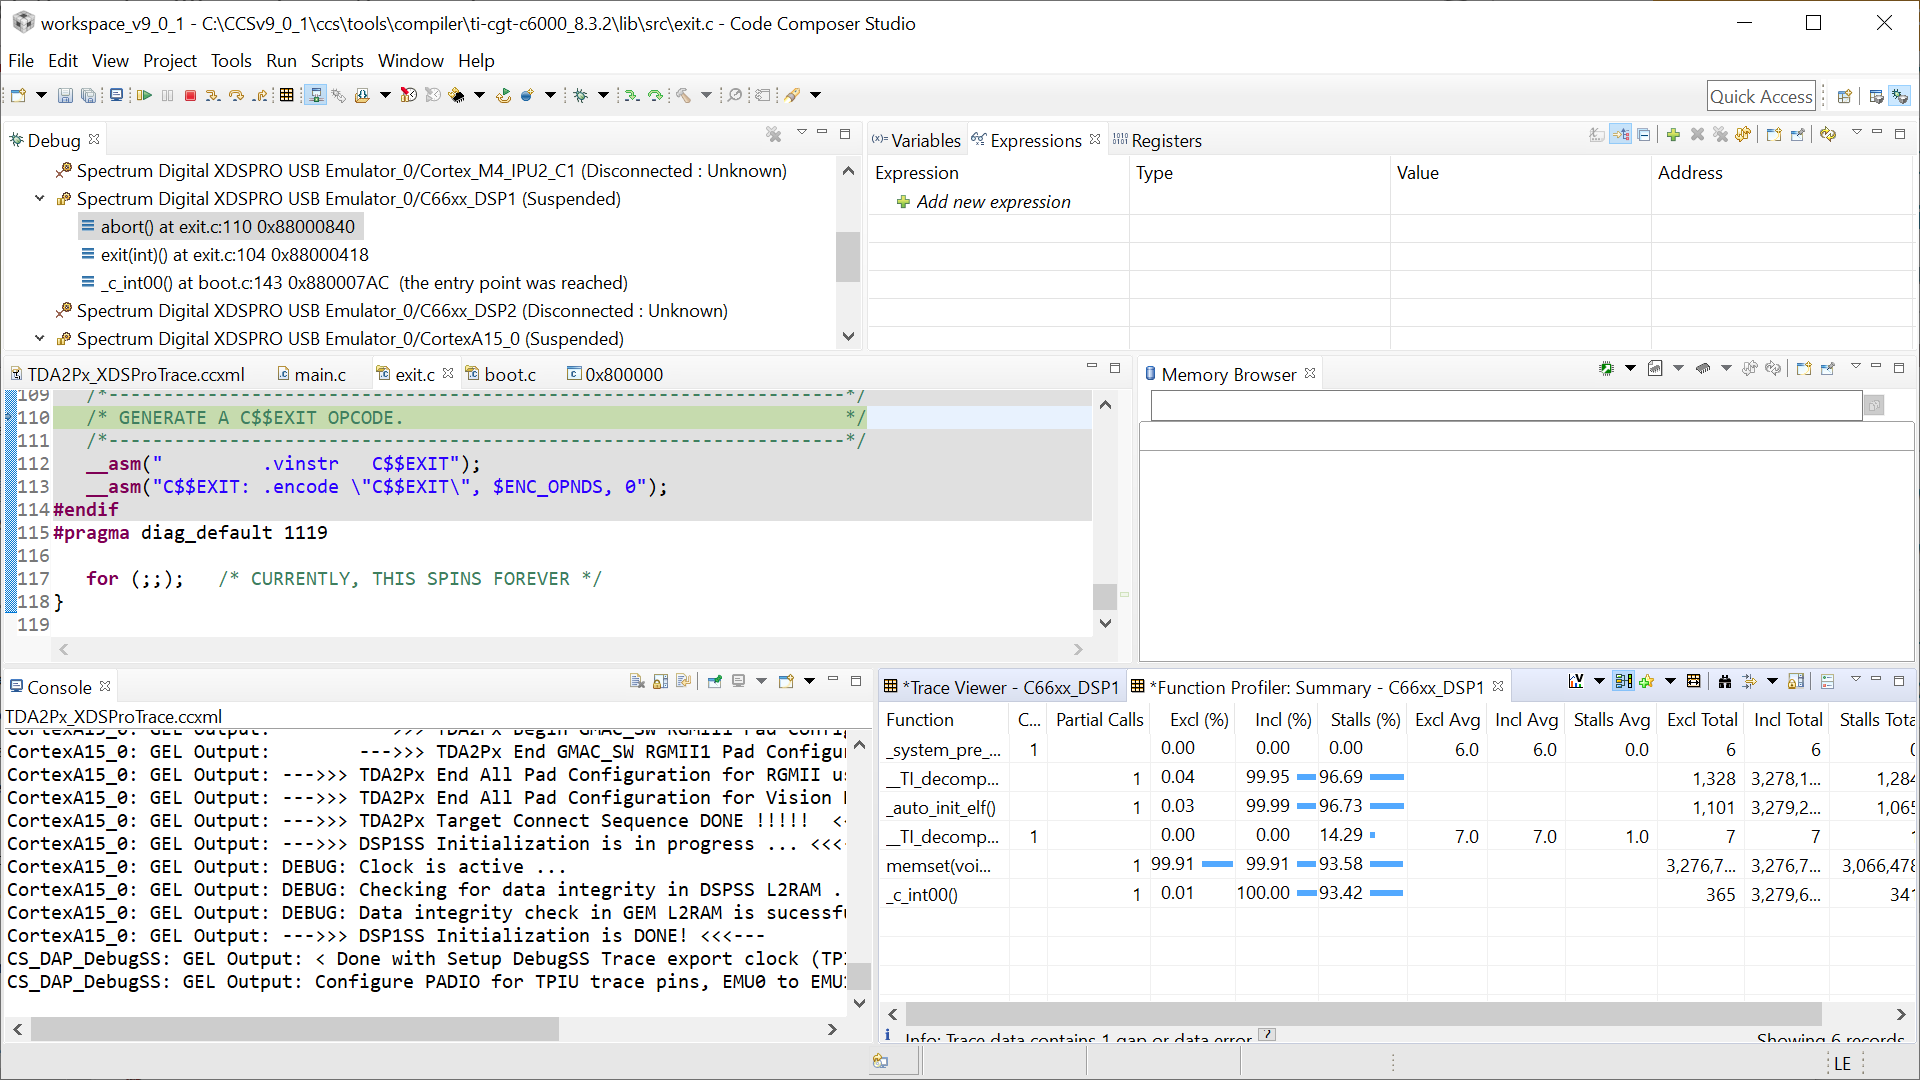
Up to this point everything is working fine. But when I try to start the 'Function Profiling' I get the following error:


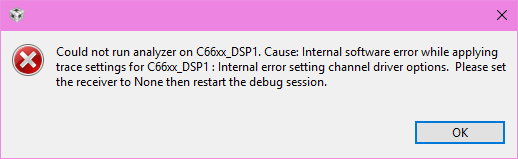
Is there any hardware / peripheral inside the chip that could be disabled (or maybe blocked by the MPU) that is needed for tracing?

  • Hi

    Based on the message, when you try the receiver to "None" does the issue go away?

    Linux does gate clocks which could be reason you are seeing this.

    Can you please check if the L3INSTR clocks are enabled in your system with Linux? CM_L3INSTR_CLKSTCTRL

    Thanks and Regards,
    Piyali
  • Hi,

    I checked the CM_L3INSTR_CLKSTCTRL register. Its value was 0x703. To me this looks like the clocks are running.

    But I do not know where I should set the receiver to 'None'. I tried the Advanced Config in the Hardware Trace Analysis Configuration dialog. There is one entry for the Receiver, but I could not change anything. Can you supply a screenshot or quick instruction on how to set the Receiver?

    Thanks and regards,
    Sascha
  • Hi Sascha,

    Kindly refer to the Section 6.2 C66x DSP PC Trace of the www.ti.com/.../sprac17b.pdf for the steps. Kindly check if you are following the steps mentioned here.

    Thanks and Regards,
    Piyali
  • Sorry for my delayed answer. I was out of office.

    I followed the steps mentioned in the instruction 'sprac17b.pdf'. I went through all steps up to step 10, although the meaning of most of the advanced config options remains unclear to me. I did not find any option to 'set the receiver to NONE', whatever that means.

    When clicking on start (step 11) I get the error message from my original post.

    Regards,
    Sascha

  • Sascha,

    I am forwarding your question to the CCS experts. Can you please post the CCS and TI emulator package version you are using?

    Thanks and Regards,

    Piyali

  • Hi Piyali,

    we are using Code Composer 9.0.1

    The TI Emulators package is version 8.1.0.00012

    TI Emulators Plugin version 1.0.4.201902191315

    The debugger is a XDS560v2 Pro Trace, Part# 513510-0001 Rev B

    Regards,

    Sascha

  • Sascha,

    Sorry about the delay; I was only able to borrow a TDA2P board today to test this. 

    I was able to properly configure and test a small C66x core pin trace session on my setup; I am using the same tool versions as you and the DRA76xP/DRA77xP/TDA2Px-ACD EVM rev C. This rules out any intrinsic issues with the tool itself. 

    However, I don't have a Linux session running simultaneously, which may complicate things due to clocking (as mentioned before). To test this theory, can you try to issue a C66x DSP trace session but without any code?

    One additional theory is related to the MMU. I am not sure if you are using it on the C66x, but it can block access to specific Trace and debug registers. This is something discussed at the post below, although it is related to ETB, which is much more sensitive to the memory buffer. Again, to test this theory you could try to run Trace with a simple DSP code. 

    https://e2e.ti.com/support/tools/ccs/f/81/p/794279/2976139#2976139 

    I don't think the MMU on the A15 (configured by Linux) would cause any problems. Obviously it is worth a test: simultaneously halt all the cores running LInux (just select each A15 core using the "Ctrl" key and then click on halt), then go to menu Tools → ARM Advanced Features → uncheck the MMU Enabled checkbox. Then, go to the DSP and try to enable Trace. During this process, keep the A15 cores halted. To resume the operation, re-enable the MMU and put both cores to resume simultaneously. 

    One additional detail that may be influencing this is invalid temporary Trace files. Exit CCS and then erase the directory %HOMEPATH%/.TI-trace. This can overcome anything from previous runs. 

    Apart from this, I really can't think of anything else that could be causing the problem, but I will report back to this thread if I find anything relevant. 

    Hope this helps,

    Rafael