Part Number: TDA2SX
Tool/software: Code Composer Studio
Hi All,
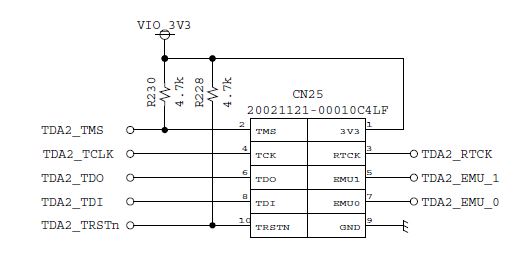
We want to get statistics on the system behavior (memory throughput) and for that we are trying to use the HW trace analyzer, the issue is that we are not getting data, is there anything else we need to do before using this feature? we are using the ETB with 14p Jtag connection,
We have already went over the sprac17b.pdf document,
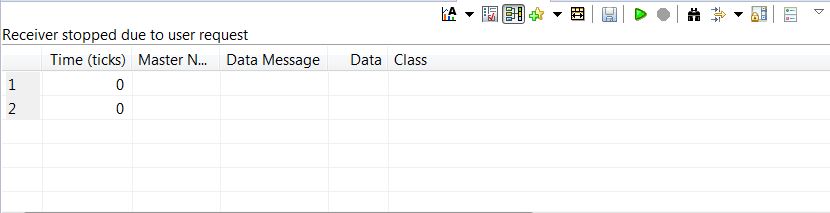
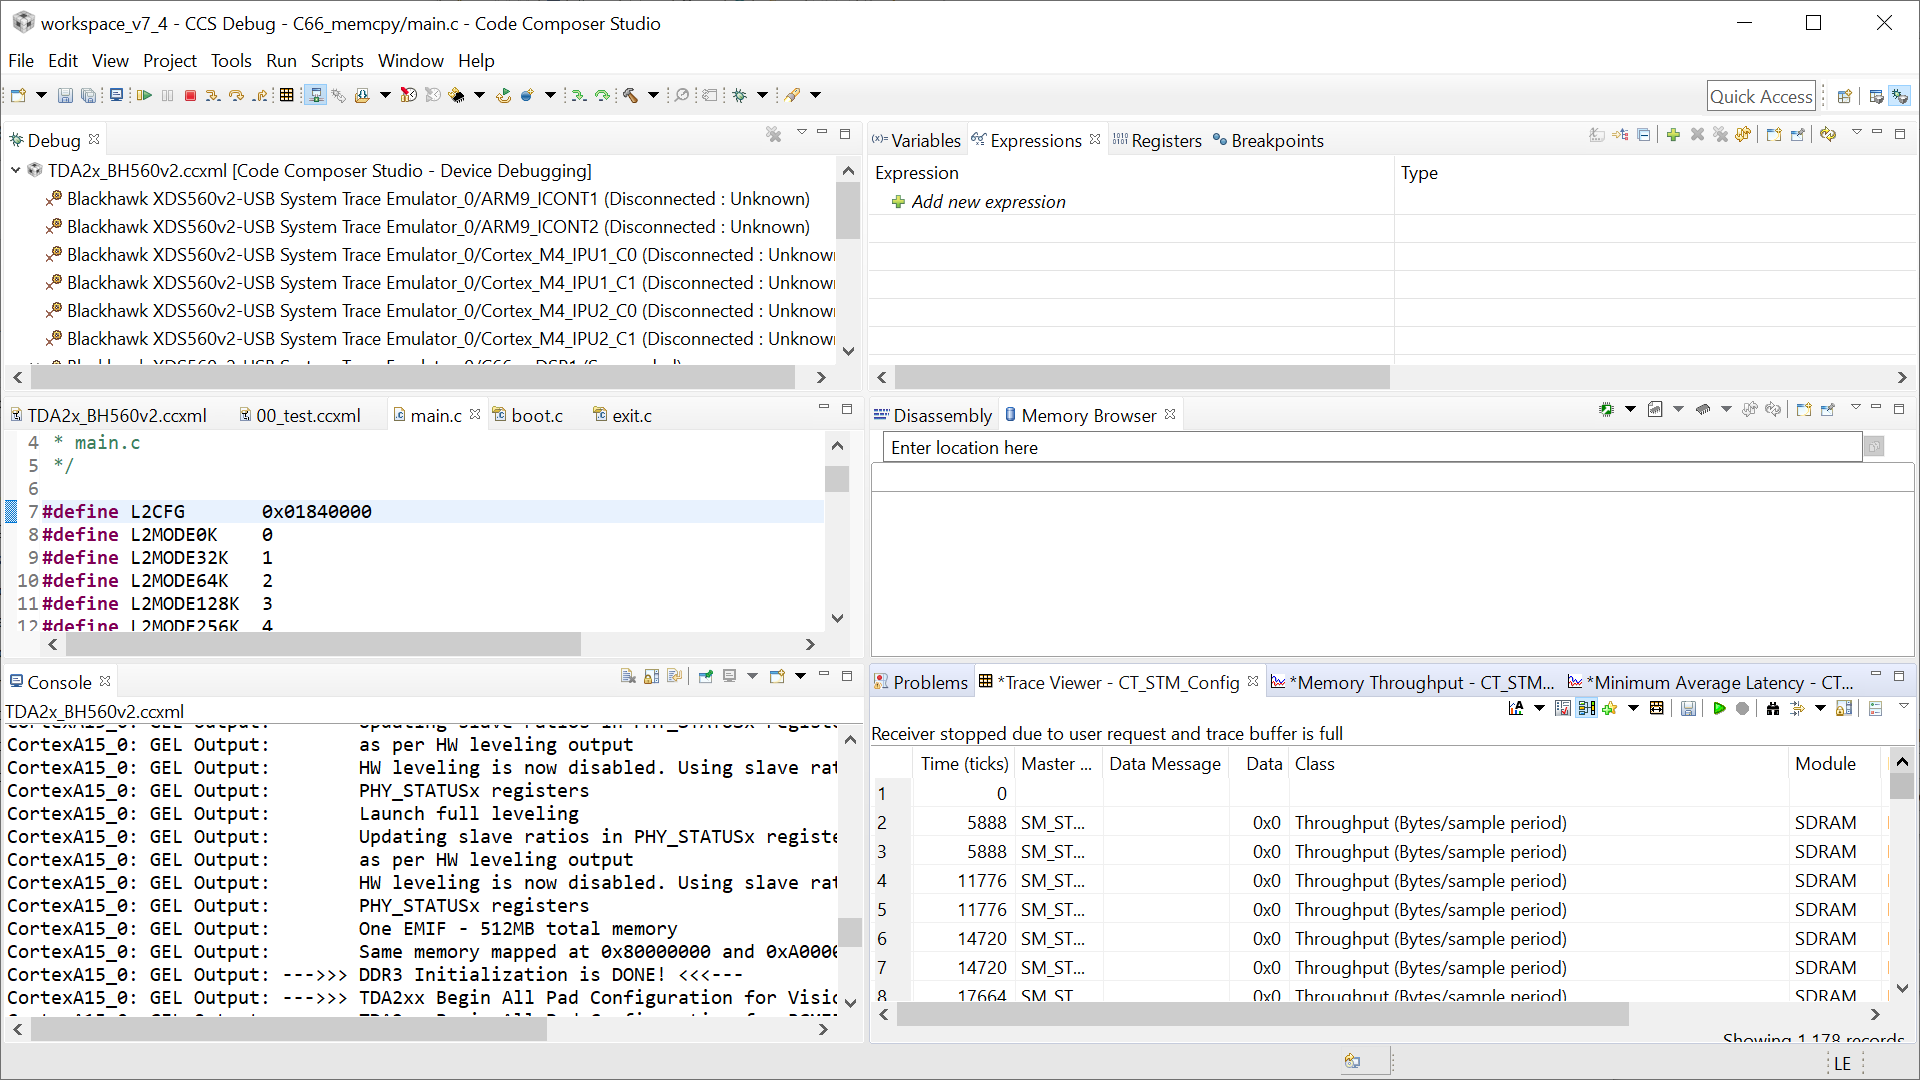
The below is what we are getting,

Many Thanks,
HR