Part Number: AM3352
Tool/software: Code Composer Studio
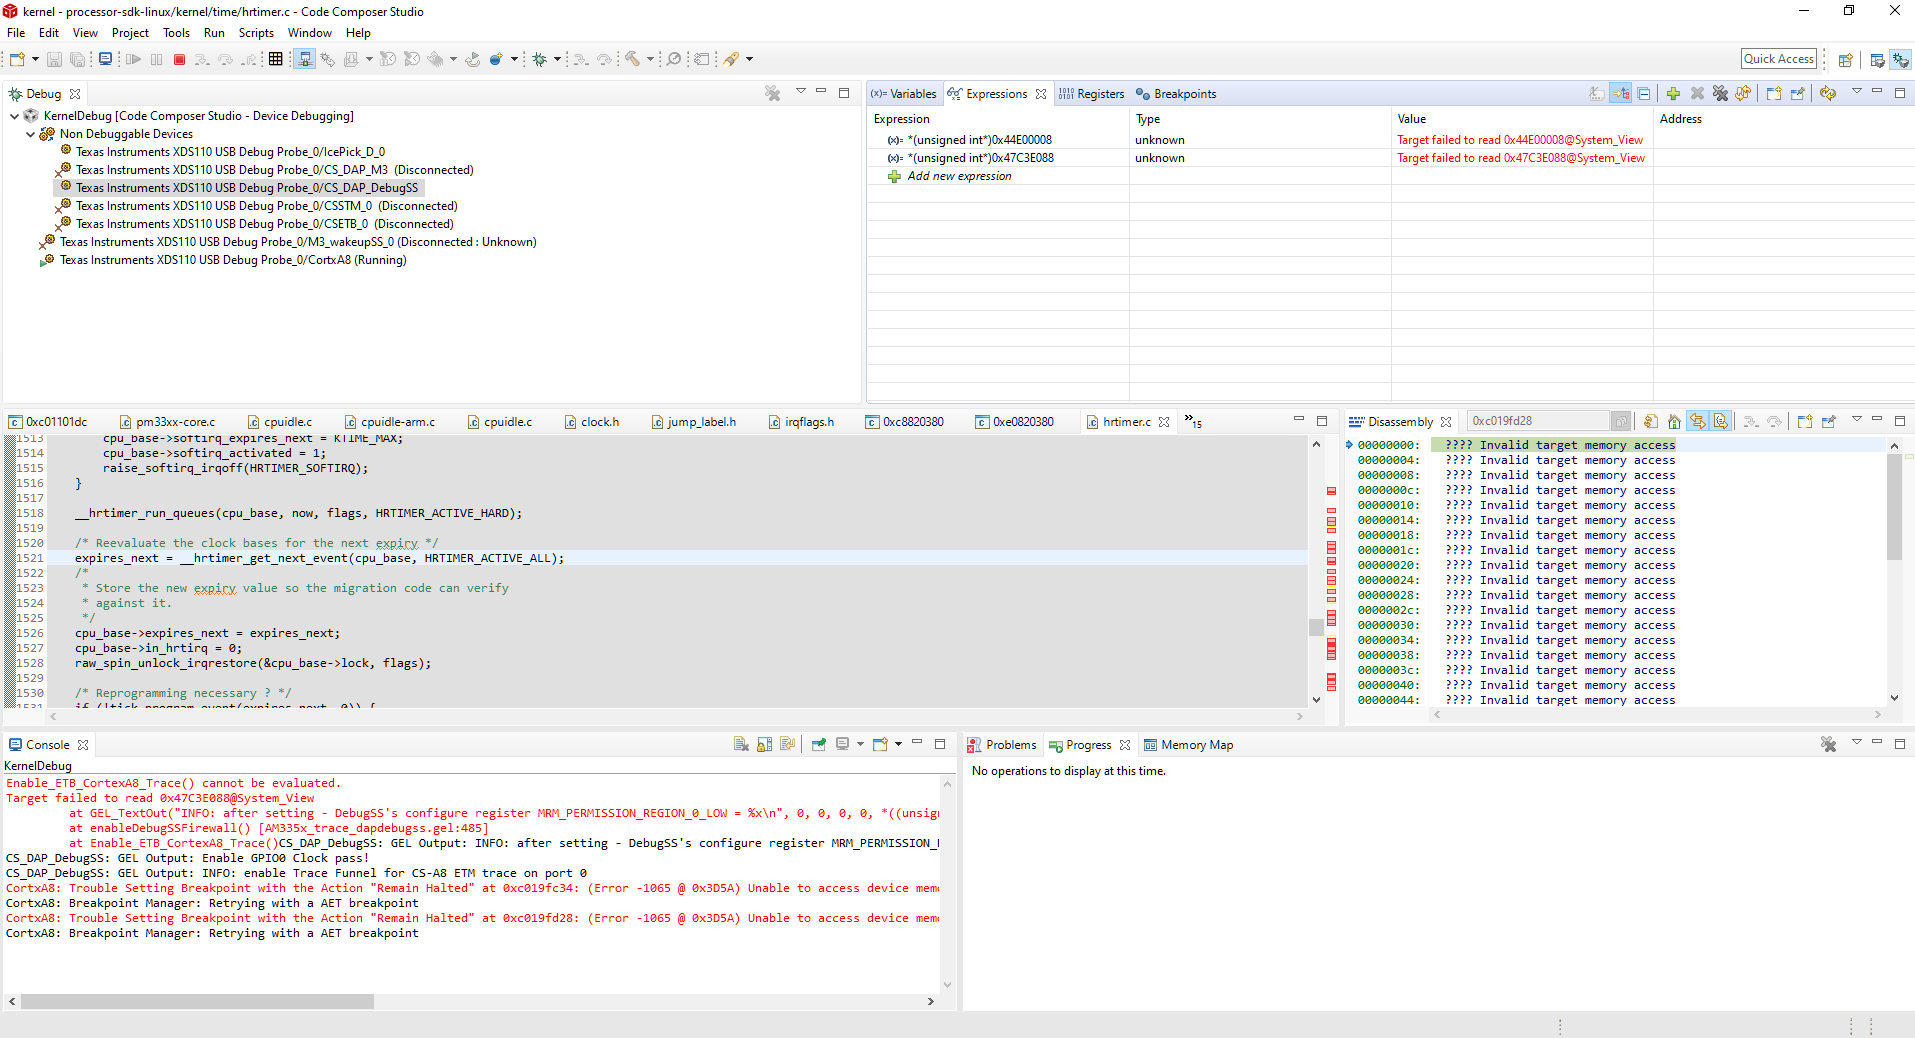
I am attempting to access the ETB and turn on traces while Linux is running.
When I click Enable_ETB_CortexA8_Trace in Code Composer, I get the following error.
Target failed to read 0x47C3E088@System_View
at GEL_TextOut("INFO: after setting - DebugSS's configure register MRM_PERMISSION_REGION_0_LOW = %x\n", 0, 0, 0, 0, *((unsigned int *) ((unsigned int) 0x47C3E000+0x88))) [AM335x_trace_dapdebugss.gel:635]
at enableDebugSSFirewall() [AM335x_trace_dapdebugss.gel:485]
at Enable_ETB_CortexA8_Trace()
I have reviewed this article, which describes a similar problem:
https://e2e.ti.com/support/processors/f/791/p/343237/1204267?tisearch=e2e-sitesearch
I made the recommended am33xx_debugss_hwmod structure change, which gets me part way there: I can connect XDS110, inspect CortexA8 memory, and perform source debugging of the kernel with breakpoints.
In the register window, I noticed CM_PER_L4FW_CLKSTCTRL had 0x00000101 after Linux is up. I changed this value to 0x00000102, and I'm still having the issue with Enable_ETB_CortexA8_Trace.
Are there other setup steps in addition to L4_FW clocks mentioned in the article?
Is anyone who is using PROCESSOR-SDK-LINUX-AM335X 6.01.00.08 able to trace using ETB ?