This thread has been locked.

If you have a related question, please click the "Ask a related question" button in the top right corner. The newly created question will be automatically linked to this question.

TCI6638K2K: Wrong PC Trace Results for XDS560V2 PRO Tracer

Part Number: TCI6638K2K


Hi,

I am currently using XDS560Pro tracer and TCI6638K2K device.

I used the tracer to analyze the results of the PC trace tools such as Function Profiler and Code Coverage.

I created the following example source code to investigate the accuracy of the tracer.

As a summary for the source code:

  • bounded_func() is called 20000 times
  • called_control_func() is called to see the calling times
  • sprintf_func() is called to use the sprintf function (CPU consumes more cycles than other functions).
  • non_called_func() isn't called it is just a test function for code coverage results.
  • limitless_func() is called to increment a variable.

You can evaluate the code.

#include <stdint.h>
#include <string.h>
#include <xdc/std.h>
#include <xdc/runtime/System.h>
#include <stdio.h>

unsigned long cnt_20000 = 0;
unsigned long cnt_test_fxn2 = 0;
unsigned long cnt_sprintf_called = 0;
unsigned long cnt_limitless = 0;


void bounded_func() {

    cnt_20000+=1;
}

void called_control_func() {

    unsigned long i;

    cnt_test_fxn2++;

    for (i=0; i<20000; i++) {

        if (i % 2) {
            cnt_test_fxn2--;
        }
        else {
            cnt_test_fxn2++;
        }
    }
}

void sprintf_func() {

    unsigned char tmp_buff[128] = {0};
    unsigned long i;

    cnt_sprintf_called++;

    for (i=0; i<100; i++) {
        sprintf(&tmp_buff[0], "Test Message for test_fxn3, i: %u", i);
    }
}

void non_called_func() {
    unsigned long cnt_non_called =101;
}

void limitless_func() {
    cnt_limitless+=1;
}

main() {
    int idx=0;
    while (TRUE) {
        if (idx<20000){
            bounded_func();
        }
        called_control_func();
        sprintf_func();
        limitless_func();
        idx+=1;
    }

    return 0;
}

For the test procedure, I followed the below instructions:

  1. Restart the device
  2. Connect the device when it starts
  3. Load Program (.out file that is created by the given source code)
  4. Tools>Harware Trace Analyzer>PC Tools and create the PC Tools with fig.1 options.
  5. Run the device
  6. Stop it after a short time. (%1 fulled of tracer fig. 2)

Figure 1 Options of PC Trace

Figure 2 Overall records and percentage of the ProTracer memory

The test procedure and the main function begin simultaneously.

The following results have occurred:

1* Figure 3 shows that bounded_func() variable (cnt_20000) is counted up to 20000 which means that bounded_funct() should have been called 20000 times. However, as you can see in Fig 4. It is called just 35 times.

2* sprintf function is called 100 times in the sprintf_func(), so the calling times should have been a linear correlation. However, as you can see in Fig 4. sprintf_func() is called 7812 times whereas sprintf() is called 9221 times. 

3* There is no record for Cache Event Profiler and Stall Cycle Profiler (fig 5)

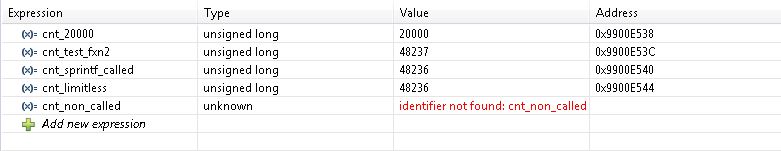
Figure 3 Expressions of the functions

Figure 4 Function Profiler View

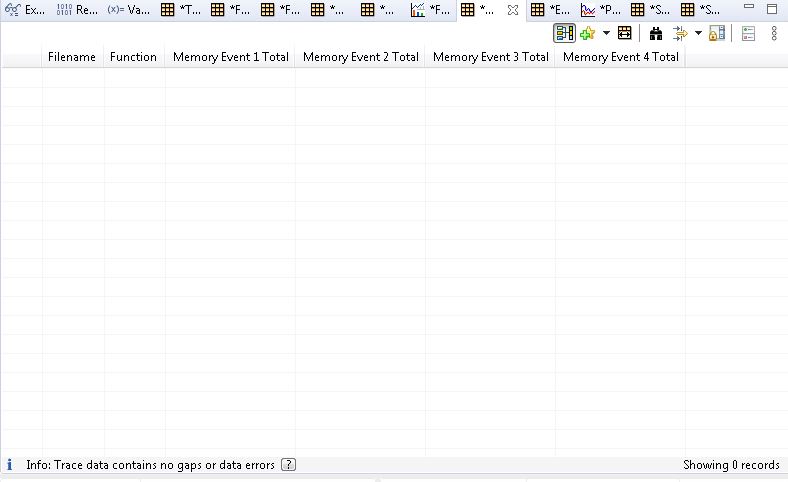
Figure 5 Cache Event Profiler View

Why the above results are occurred whereas different ones expected?

There are 38 588 428 records (fig 2) and 21 900 135 cycles, so can i calculate the trace duration as the following equation?

Trace Duration = Cumulative cycle / CPU frequency(1.4GHz) : 21 900 135/ 1 400 000 000 = 15.6429 mS

For my real program which is much more complicated and big CCS is shut down immediately after the  trace job is completed, how could i fix the problem?

Code Coverage isn't working for the real program what can i do?

Thanks, Enes

  • Hi,

      Unfortunately, there is currently no technical support if the problem is TCI6638K2K specific either hardware or software. Please refer to this FAQ. https://e2e.ti.com/support/processors/f/791/t/809582. I understand this may not be the answer you are looking for but this is the current status for this device as far as the support is needed. 

  • Hi,

    I understand, but the source of the problem is not clear. Thus, from my point of view, you shouldn’t ignore it.

    It might be based on the test technique, tracer device or expectation etc...

    As you can understand, TI ensures that there must be an expected result for either k2k or different devices.

    And I share my results with you but the result doesn’t match with expected ones.

    If I couldn’t see any results, you might be right, the problem could base on the device. However, I see results that are not accurate

    Thanks

  • This thread has been sent over to the tools team.  I am not sure how much we are going to be able to help with this as we do not have access to this device.

    One thing to try would be to see if you get expected results when configuring the trace to be directed to the Embedded Trace Buffer (ETB) instead.  You will likely have to shorten your test case to not overflow the buffer but you can see if you get the expected results for a shorter run.

    Regards,
    john

  • Hi John,

    I uploaded the same project to the DSP core and observed the expected values are satisfied in this core for trace data.

    Then I tried it back to the ARM core, it still suffers from the accuracy.

    Maybe this experiment would help you.

    Also for DSP Core, I couldn't see any result for code coverage analysis.

    I tried to change the transport type to ETB but the same accuracy problem for ARM cores are continuing.

    Thanks,

    Enes

  • Enes.

    DSP

    • DSP trace works fine.
    • Coverage is not displaying anything

    ARM (A15)

    • Trace values do not look correct when streaming trace or using ETB.

    Well that means there is no problem with the Pro Trace unit.  So either trace is not working in the A15 core itself or there is some issue with decoding the data or something else is going on.  Is optimization on when building?  bounded_func() does nothing other than incrementing a variable.

    Honestly I am not sure what I will be able to do to help.  I was hoping that ETB would work and that would point to some issue with streaming the data off the device but as that is showing the same results.

    You mentioned that CCS shutdown.  Was there a crash log produced?  If so you could try archiving and sending them.  There is more info on how to do that here: https://software-dl.ti.com/ccs/esd/documents/ccs_diagnostic-logs.html

    We might be able to see something in the logs.

    Regards,

    John