This thread has been locked.

If you have a related question, please click the "Ask a related question" button in the top right corner. The newly created question will be automatically linked to this question.

PROCESSOR-SDK-AM335X: Crash on Startup... "memset" ??!!

Part Number: PROCESSOR-SDK-AM335X
Other Parts Discussed in Thread: SYSBIOS, AM3358

Hello,

See subject line.

My test environment is BBB, using CCS 10, TI compiler 17.2STS, XDC 3.32.2.25, SYSBIOS 6.46.5.55.

It was working, but needed more heap.  I altered the task stack size and heap size in the CFG file...  Suddenly this is happening.

On startup of a test program, it doesn't even get to "main()"  It is crashing on memset, which I assume is the _c_int00 entry point clearing all global memory.

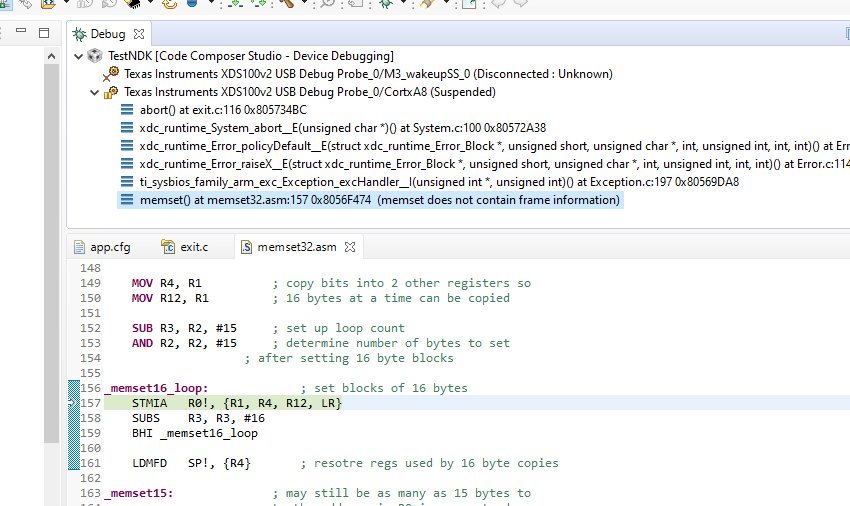
What the heck????!!!!

Is it because it is updating memory it's not supposed to?   

Here is a portion of my map file... It's more memory than the BBB has:

OUTPUT FILE NAME: <TestNDK.out>
ENTRY POINT SYMBOL: "_c_int00" address: 80570758


MEMORY CONFIGURATION

name origin length used unused attr fill
---------------------- -------- --------- -------- -------- ---- --------
SRAM_LO 402f0000 00000400 00000000 00000400 RW X
SRAM_HI 402f0400 0000fc00 00000000 0000fc00 RW X
OCMC_SRAM 40300000 00010000 00000000 00010000 RW X
DDR3 80000000 20000000 00593529 1fa6cad7 RWIX

Why does it think it needs to reserve half a gig of memory for a program that is about 1/100th the size??  Where is it inventing that idea??

Here is the app.cfg file: some of which I have no idea what it means, or how it selected those values

var Defaults = xdc.useModule('xdc.runtime.Defaults');
var Diags = xdc.useModule('xdc.runtime.Diags');
var Error = xdc.useModule('xdc.runtime.Error');
var Log = xdc.useModule('xdc.runtime.Log');
var LoggerBuf = xdc.useModule('xdc.runtime.LoggerBuf');
var Main = xdc.useModule('xdc.runtime.Main');
var Memory = xdc.useModule('xdc.runtime.Memory')
var SysMin = xdc.useModule('xdc.runtime.SysMin');
var System = xdc.useModule('xdc.runtime.System');
var Text = xdc.useModule('xdc.runtime.Text');

var BIOS = xdc.useModule('ti.sysbios.BIOS');
var Clock = xdc.useModule('ti.sysbios.knl.Clock');
var Swi = xdc.useModule('ti.sysbios.knl.Swi');
var Task = xdc.useModule('ti.sysbios.knl.Task');
var Semaphore = xdc.useModule('ti.sysbios.knl.Semaphore');
var Hwi = xdc.useModule('ti.sysbios.hal.Hwi');

var Seconds = xdc.useModule('ti.sysbios.hal.Seconds');
Seconds.SecondsProxy = xdc.useModule('ti.sysbios.hal.SecondsClock');

System.maxAtexitHandlers = 4;

BIOS.heapSize = 4292608;

BIOS.libType = BIOS.LibType_Custom;

Program.stack = 65536;

Task.defaultStackSize = 8192;
Task.deleteTerminatedTasks = true;

SysMin.bufSize = 0x200;

var loggerBufParams = new LoggerBuf.Params();
loggerBufParams.numEntries = 16;
var logger0 = LoggerBuf.create(loggerBufParams);
Defaults.common$.logger = logger0;
Main.common$.diags_INFO = Diags.ALWAYS_ON;

System.SupportProxy = SysMin;

Task.addHookSet({
registerFxn: '&NDK_hookInit',
createFxn: '&NDK_hookCreate',
exitFxn: '&NDK_hookExit'
})

I have no idea if that has anything to do with it crashing on memset, or if that is the reason.

The console registers display as

 100

However the debugger registers are different:

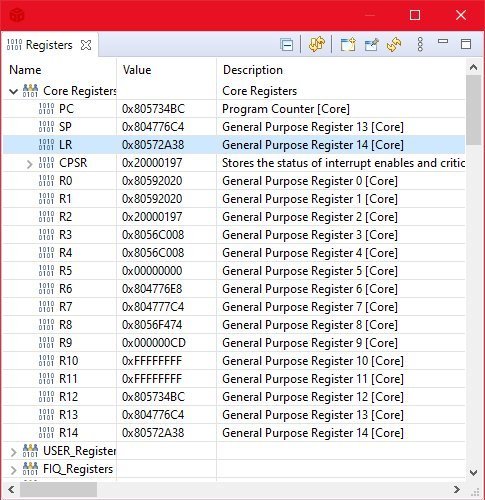
Any one have ANY clue?  And can explain this to me?

  • Hi,

    Can you please make sure it is the memset which causes the crash? Also, if this is repeatable crash, you can check if the memory it is accessing and if the ARM has permissions to access those memory areas.

    Please let me know.

    Thanks

  • Aravind,

    My screen shot show shows the crash. You can see at the bottom of the stack trace it's "memset".

    When the debugger is launched, it is supposed to set a break point at "main()" which means all the C initialization has occurred. This is happening without ever reaching that breakpoint.  I see no way to place a breakpoint BEFORE main() when it SYSBIOS because it does everything under the covers and behind my back.

    Also, if the MMU has not been set up to allow permissions to this memory, that again is something that is done under the covers and behind my back.  This project actually has a call to setup the MMU, but (obviously) that occurs once main() is entered.  And execution never gets there.

    It reliably does this.  it didn't used to.  I changed the heap and stack size, and it started and won't stop.  Even when I return them to the previous settings, it continues to crash.

    I really hate the way this does this kind of crap behind my back, altering other settings that I have no control over and need a PhD to figure out what is going on down in the bowels.

  • Hi Christopher,

    You can disable goto main option under CCS to single step. This allows you to step through everything pre-main.

    Uncheck "On a program load or restart" to prevent it to run to main, so that you can single step premain programs.

  • Well, none of this works.  But that doesn't surprise me in my dealings with this horrid environment.

    There is NO tools menu in the CCS window when editing.

    The tools menu doesn't have that option in the debug perspective.

    Next up... I need to HACK the gwad awful, undocumented, incomprehensible "ccxml" files.  I've got over a dozen in all the unit test programs, and can't make sense of ANYTHING in there.  Double clicking on one takes you to a screen that has ZERO explanation I've been able to find.

    (And one of them does exactly what I need, but CANNOT figure out why...  it terrifies me to touch it, as it'll start doing stuff I don't want, and I'll NEVER get it back -  Another "feature" increasing my disdain for this environment)

    I right clicked on one, and selected "debug as" ->  "Code Composer Studio..."  

    It acted EXACTLY as it did when I press "Debug"...  Loads the program immediately and tries to run to the break point.  Of course it crashes.

    NO OPTION to tell it not to do that.  (What crap this is...)

    Next...   "debug as" ->  "Debug configurations" ... It's giving me M2 and A8, but not the PRU's  (that MIGHT be a clue).  I uncheck the "run at startup" and press debug.

    Now I step through "boot.asm" which is from the SYSBIOS source folder.  

     At line 356 is BL's (branch on link register) to __TI_auto_init...

    In auto_init.asm  it enters the _b1_loop_ at line 364 and on the third loop it calls BLX r4. (whatever the third entry is in the "cinit" table...  no doc, I have no idea.)

    And that is into "copy_zero_init.c"   And the stack traces shows it is in memset  (why did you not believe me??)

    At this point, R0 is 0x80000000 (as expected), and R2 is 4D6C9E (which matches the map file .bss segment size).  It crashes when calling BX LR in an attempt to return  ( LR = 0x8056EEA8)

    Which, according to my map file, is in the .text segment.

    SEGMENT ALLOCATION MAP
    
    run origin  load origin   length   init length attrs members
    ----------  ----------- ---------- ----------- ----- -------
    80000000    80000000    004d6c9e   00000000    rw-
      80000000    80000000    004d6c9e   00000000    rw- .bss
    804d6ca0    804d6ca0    0009a458   0009a458    r-x
      804d6ca0    804d6ca0    0009a458   0009a458    r-x .text
    805710f8    805710f8    00010000   00000000    rw-
      805710f8    805710f8    00010000   00000000    rw- .stack
    805810f8    805810f8    00006d35   00006d35    r--
      805810f8    805810f8    00006d35   00006d35    r-- .const
    80587e30    80587e30    000001d0   00000000    rw-
      80587e30    80587e30    000001d0   00000000    rw- .data.1
    80588000    80588000    00007ba6   00000000    rw-
      80588000    80588000    00004000   00000000    rw- ti.sysbios.family.arm.a8.mmuTableSection
      8058c000    8058c000    00003ba6   00000000    rw- .data.2
    8058fc00    8058fc00    00001298   00001298    r--
      8058fc00    8058fc00    00000040   00000040    r-- .vecs
      8058fc40    8058fc40    00001258   00001258    r-- .cinit

    But would appear to be in the middle of the "Error.oea8fnv function":

                      8056ee24    00000068     sysbios.aea8fnv : BIOS.obj (.text:ti_sysbios_heaps_HeapMem_init__I)
                      8056ee8c    00000068     ti.targets.arm.rtsarm.aea8fnv : Error.oea8fnv (.text:xdc_runtime_Error_setX__E)
                      8056eef4    00000068                                   : LoggerBuf.oea8fnv (.text:xdc_runtime_LoggerBuf_Instance_init__E)
                      8056ef5c    00000064     phy.obj (.text)

    Now... why is it branching into an error handler??

    Because IT USED TO WORKAll I did was have the unmitigated gall to change the stack/heap size in the CFG file. It broken something somewhere, that is hidden from me...   Now changing it back doesn't fix it.

    <rant>

    I've been doing assembler for decades, I know the conceptual innards of an MCU.  Although ARM only part-time for the past couple years. 

    No other environment hides and obfuscates as much as this stuff does.  It's costing a lot of time/money trying to unravel all this stuff, especially when ALL (and I mean EVERY ONE) of the tutorials is all "here's a simple 'hello world' program... congratulations! You are an embeded programmer now!!"     And then later when stuff breaks...  "What do you mean you can't figure out 'X' ???  It's right there on that page that never comes up in a search, and wasn't linked to in ANY of those tutorials!!  Why haven't you read that 5,000 page doc which is unlocatable??  RTFM!!!" 

    </rant>

  • Hi Christopher,

    I see you are going through many issues. 

    There is NO tools menu in the CCS window when editing.

    The tools menu doesn't have that option in the debug perspective.

    - Can you let me know your CCS version? Note that you need to select the core you are debugging to get to this menu. Also, make sure you are on CCS debug view.

    Example: Here I selected the Cortex A8 core under CCS Debug:

    After that when you click on Tools, you would get this menu option.

    It acted EXACTLY as it did when I press "Debug"...  Loads the program immediately and tries to run to the break point.  Of course it crashes.

    NO OPTION to tell it not to do that.  (What crap this is...)

    - The option that I provided to disable the run to main(), would make the program just load and it would wait for you to either run or single step to reach to main().

    Let me know if you still have issues to disable the PC run to main(). Please provide your CCS version details etc so that I can match exact versions and possibly guide on getting the disable "run to main()" option for you.

    PS. The CCS version that I used for this snapshot pictures is: (Via Help-> About Code Composer Studio:

    Thanks

  • I have no idea if that has anything to do with it crashing on memset, or if that is the reason.

    From the console exception dump:

    DFSR = 0x00000805. Decoding as per Data Fault Status Register :

    • RW = 1 = write access caused the abort.
    • Status = b000101 translation fault, section

    Memory access sequence says:

    If translation table walks are disabled, the processor returns a Section Translation fault.

    This means the MMU has generated a translation fault. FSAR = 0x80100000 is the address at which the fault occurred which is an offset of 1Mbyte from the start of DDR3.

    From the map fragment address 0x80100000 is within the .bss section, so at start up the run time library initialisation code will be zeroing the .bss section.

    So, it looks like something has gone wrong with the MMU configuration in the project.

    In CCS 10.2 I just imported a project using the SYS/BIOS "typical" example for a BBB using the same XDC 3.32.2.25, SYSBIOS 6.46.5.55 as you are using, and the only change I made was in the .cfg file to set the same heap size as you are using:

    /*
     * The BIOS module will create the default heap for the system.
     * Specify the size of this default heap.
     */
    BIOS.heapSize = 4292608;

    And the segment allocation map is similar to yours in that the .bss section starts at 0x80000000 with length 0x0041b128. The example initialises and runs OK.

    In CCS "MMU On" is reported in the target status as the bottom left, and using the MMU view the RTOS Object View (ROV) shows the MMU has been configured to set the DDR region as Cachable with Read/Write access.

    The default of SYS/BIOS is to configure the MMU to give cachable read/write access to all of the memory regions defined in the platform. From memory, the only manual step normally required to the MMU configuration is to enable mappings for some peripherals, but that is not your problem.

    I have attached my example.

    I'm not sure what has gone wrong with your program. Are your able to zip up and attach your project, to aid looking at what causes the apparent MMU configuration issue?

    BBB_TI_typical.zip

  • Next up... I need to HACK the gwad awful, undocumented, incomprehensible "ccxml" files. 

    Since you are using a BBB, in the target configuration file you should just be able to select the debug probe as the Connection, and then enter BeagleBone_Black as the Board or Device to use a usable setup:

    Which should set the initialisation script for the CortxA8 to ../../emulation/boards/beaglebone/gel/beagleboneblack.gel 

    The GEL file for the initialisation script is important to configure the BBB to allow a program to be run.

    Which initialisation script are you using?

    If I take my working target configuration file and change the Board or Device from "BeagleBone_Black" to "AM3358" the initialisation script for the the CortxA8 is blanked and the program then crashes before main is reached. E.g. got the following exception which has the same DFSR register value as your crash, albeit the DFAR value is different:

    [CortxA8]  0x00000000  R8  = 0xffffffff
    R1 = 0x804262c4  R9  = 0xffffffff
    R2 = 0x00000000  R10 = 0xffffffff
    R3 = 0x00398669  R11 = 0xffffffff
    R4 = 0x8042def0  R12 = 0x80426704
    R5 = 0x8042159c  SP(R13) = 0x8042134c
    R6 = 0x80426e64  LR(R14) = 0x80419fac
    R7 = 0x80426e88  PC(R15) = 0x8042134c
    PSR = 0x80426e64
    DFSR = 0x00000805  IFSR = 0x00000000
    DFAR = 0xfffffffc  IFAR = 0x00000000
    ti.sysbios.family.arm.exc.Exception: line 205: E_dataAbort: pc = 0x8042134c, lr = 0x80419fac.
    xdc.runtime.Error.raise: terminating execution

  • Chester,

    Thanks for trying.

    I've never seen anything defining the DFSR register.  It's not in the ARM books I've got, but those are mostly "M" cores.  Of course attempting any kind of a search in the TI world gets me nothing.

    I tried changing the CCXML "board or device" to BBB, as somehow it was changed to just a AM3358.  It didn't make any difference, my MAP file still showed that is has 1 gig.

    Until I come back and retry this weekend after comfortably attempting to forget all the trouble this is giving me.

    This morning it works.  

    I am marking this as resolved, except I don't know why. It appears to have resolved itself after deciding that when I changed the "board or device" from the correct MCU to the correct board... I really meant it.  Or decided that it needed a reboot.  Or decided that daylight savings time would solve it.

    I did open the ROV and examine the MMU, which I have no control over prior to "main" being reached.  Interesting lesson, but now that it decided to just start working, it's not an issue.

    Except now when I started a DIFFERENT unit test program, it's asking me which core.   For TWO WEEKS I was using this test program, and it (as usual) only asked me one time when I created it.  Now it decided to forget.

    Speaking of images, that screen you posted in unreadable. I do not know where "In CCS "MMU On" is reported in the target status as the bottom left, " is.  (the old E2E pages at least let you zoom into images.  Apparently no one though that was useful anymore)

    I am using CCS 10.1.1, but because the child windows are all moveable and re-docable, there is no way your screen shot would look anything like mine (which is why I usually import things and then highlight them if needed)

    As for CCXML file, if you care to explain something else, see this post...  Because I cannot make any sense of why or how these things work.

    https://e2e.ti.com/support/processors/f/processors-forum/985638/processor-sdk-am335x-ccs-question

    Half the time they effect how a "project" reacts when I press "debug," half the time I have to right click and pick Debug As | Debug configurations...  and then they all mix into a soup where all the CCXML file randomly apply to any project.

    GEL files, CMD files, CCXML, I can't find any comprehensive stuff on it, but I can demonstrate where things are broken.

    Also, Aravind keeps asking which version of the PDK...  Except I'm not using the PDK.  This uses only the SYSBIOS and XDC.  The code for bare metal access is imported and modified from the old Starterware.

  • Hi Christopher,

    Glad to see you finally got this resolved. I do not know, if you had searched ARM TRM for DFSR register. The register is from ARM and hence you would not see details/documentation on DFSR on AM335x TRM. For all ARM cores, please refer to ARM documentation.

    I've never seen anything defining the DFSR register.  It's not in the ARM books I've got, but those are mostly "M" cores.  Of course attempting any kind of a search in the TI world gets me nothing.

    I got below from ARM DFSR register: https://developer.arm.com/documentation/ddi0344/k/debug/debug-exception/effect-of-debug-exceptions-on-cp15-registers-and-wfar 

    Also, regarding below:

    Also, Aravind keeps asking which version of the PDK...  Except I'm not using the PDK.  This uses only the SYSBIOS and XDC.  The code for bare metal access is imported and modified from the old Starterware.

    Please note that we are supporting Processor SDK releases via e2e. That is the reason, I asked you about PDK version and releases.  Please note that, some of the older starterware releases are no longer supported.

    Your usage seems to be some what in middle, where you took the Processor SDK component (latest release of AM335x RTOS release) on BIOS and XDC, but did not refer to any processor SDK approach of creating the CCS projects or building the applications via makefile.

    I was noticing you had issues on how to prevent application to reach main() after CCS load etc and provided details/inputs on that.

    https://e2e.ti.com/support/processors/f/processors-forum/985638/processor-sdk-am335x-ccs-question

    Half the time they effect how a "project" reacts when I press "debug," half the time I have to right click and pick Debug As | Debug configurations...  and then they all mix into a soup where all the CCXML file randomly apply to any project.

    - Thanks for providing the feedback on CCS. Someone from CCS team would respond to your questions in above thread.

    Hi Chester,

    Thanks for trying out and providing responses in the e2e thread.

    Thanks.

  • Aravind,

    Our primary project of over 28 directories and 240 files was created  5+ years ago.  Starterware source was pulled directly into the project, as it was easier to implement, add functionality we need, and debug.

    Now, last time I tried the PDK while going through tutorials, was about 2-3 years ago.  And I learned that using feature "C" required feature "B", which then required feature  "A", which then feature option "D"...   There was no choice to just use any single feature without dragging in the ENTIRE collection of useless stuff.

    I think we are quite capable of coding bare metal to configure GPIO, Timers, DMA, or other things without needing support for Starterware, or pulling in libraries that are overly bloated.

    Most of my issues are NOT how to program the device.  I am quite capable of reading spruh73p, the TRM for the AM335x.  My issues are getting this environment to behave.  Everything about it is counterintuitive, obfuscated, or some of the stuff ("packages") in the CFG are completely undocumented.  And it's all JAVA.  Things break and I can't find out what's going on.

    I create unit test apps to preform development faster, and they must use the same tools the primary project uses.

    Now, I get statements like "You are not on the latest BIOS"... 

    First of all, I tried that and it was a train wreck.    My mistake for doing a search and using the latest version that came up...  Apparently, I should ignore what TI says on one page about here is the latest version, and know to go find it on another.  Because the "latest" BIOS isn't approved for Sitara.

    So I deleted all that, and installed the "approved" version of 6.76

    Anyway... I discovered it's going to require the current XDC...  which is going to require the GNU compiler... which is going to require changing a bunch of assembler... which is going to require etc etc...  It's a massive undertaking into the primary project.  So there is no justification for it at this time.

  • Christopher,

    Most of my issues are NOT how to program the device.  I am quite capable of reading spruh73p, the TRM for the AM335x.  My issues are getting this environment to behave.  Everything about it is counterintuitive, obfuscated, or some of the stuff ("packages") in the CFG are completely undocumented.  And it's all JAVA. 

    - Yes, I understand XDC is all JAVA and few things are not intuitive until you are familiar with it. Please, note that XDC and BIOS go in pairs. So, the processor SDK helps in providing necessary tools (combination that works) along with the examples and libraries.

    Please note that the RTOS release is for broad market and hence is not optimized per use case or per customer.

    On the other hand, I wanted to provide you the link for the announcement on the starterware support:

    https://e2e.ti.com/support/processors/f/processors-forum/733430/sitara-dsp-announcement-on-software 

    Also: Best Practices include while filing e2e: Please keep your issues filed with correct title and details around these areas. This can minimize the delay in getting to the right team for addressing the issues.

    1. CCS issues

    2. BIOS/XDC issue

    3. Processor SDK SW - RTOS OR Linux (I now know you are not using them)

    4. Any Hardware issues

    5. e2e usage etc

    It is not clear from your last response, if you still have any issues around above areas/components? 

    Yes, SYS BIOS/XDC needs some JAVA understanding for the CFG file and for some RTSC part. I understand, it may be challenging for some.

    On the ARM exception you are seeing for your application, I think you can go through the ARM documentation for DFSR and correlate to your application that is creating the crash.

    Please let me know.

    Thanks.

  • Aravind,

    I already marked it as resolved.

    I am 100% confident it was an access violation during memset()

    I am 100% confident it was occurring prior to main() being called

    I am 100% confident it has something to do with what MCU it thought it was talking to

    I am 0% understanding why CCS decided to change the MCU type in the properties or the CCXML on a project I've been using for months.

    I am 0% understanding why changing it back didn't have any affect until I returned after the weekend.

    But I have posted other questions trying to get an understanding of several other things.  So nothing more on this thread/subject.

  • Christopher,

    I see the thread status as "Open", due to the conversation we had after you marked it as resolved.

    I will close this thread as there is nothing more to discuss.

    Thanks