This thread has been locked.

If you have a related question, please click the "Ask a related question" button in the top right corner. The newly created question will be automatically linked to this question.

AWR6843AOPEVM: Post processing ADC data in Matlab

Part Number: AWR6843AOPEVM
Other Parts Discussed in Thread: MMWAVEICBOOST, DCA1000EVM, IWR6843AOPEVM, IWR6843AOP, IWR6843

I have a unique application to track a reciprocating pump piston rod at close proximity from 20cm to 30cm. Piston rod has a Stroke Length of 30cm with 1 to 240 Strokes Per Minute (SMP) - i.e. a maximum linear speed 0.01m/s to 2.4m/s, but the motion is complex with sinusoidal acceleration and speed, field of view 90 to 120 degrees. A model of the Piston Rod has been made for evaluation purposes. 


I have managed to connect together IWR6843AOPEVM, MMWAVEICBOOST & DCA1000EVM and understood how to use the mmWaveStudio.

But I need some help:

1. In post processing the ADC data collected with Matlab:
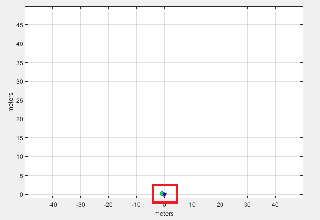
a) as the default graph scaling is to coarse for me to analyse the motion. Could you please advise me on how to post process the data with the graph window range zoomed in to +/-0.5m instead of +/-50m. i.e. with a magnification factor of 100


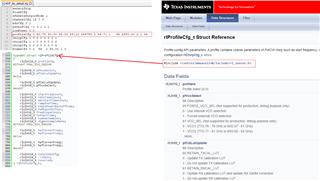
b) mmWaveStudio post processing is assumed for RX1 - RX4 in linear arrangement (a straight line ?). But the IWR6843AOP has them in a square arrangement. How to process the data with square receive antenna arrangement.

2. A guidance to set Chirp parameters in Sensor configuration for ultra short range i.e. in +/- 50cm. As I try to increase the chirp bandwidth closer to the maximum of 4GHz to increase the range resolution with high number of ADC samples (>1024) mmWaveStudio is crashing / non responsive.

09/30 2021 Edited by Moderator for content formatting.

  • HI, there:

    1) IF you are using radar studio for raw data capture, it is suggested to develop your own signal processing script for point cloud detection from the binary data, including develop your own angle of arrival algorithm and you can plot and zoom in the results as you desired.  On the other hand, you can use the OOB demo for AOP board as a starting point, which support point cloud detection for AOP antenna.  https://dev.ti.com/tirex/explore/node?node=AIHy77joqu3jXFmjqwkBKQ__VLyFKFf__LATEST ;  To understand the signal processing chain, you can either check the target code inside or go through the FMCW training video at: https://training.ti.com/intro-mmwave-sensing-fmcw-radars-module-1-range-estimation?context=1128486-1139153-1128542 

    2) You can find some information about the chirp design at: https://e2e.ti.com/support/sensors-group/sensors/f/sensors-forum/1011679/iwr6843aop-how-to-proceed-in-designing-testing-chirps

    Best,

    Zigang

  • Hi Zigang Yang,

    Thanks for you reply.

    Could you please point to me any documentation or example script "to develop your signal processing script for point cloud detection from the binary data, including develop your own angle of arrival algorithm and you can plot and zoom in the results as you desired"

    What I am looking for a sample script to start with some documentation.

    Regards

    Vithy

  • Hi, Vithy:

    We do have a MATLAB script for data parsing to read data from binary file to get a matrix format.  The script is located at: C:\ti\mmwave_studio_02_01_01_00\mmWaveStudio\MatlabExamples\singlechip_raw_data_reader_example 

    You can find the demo code and its documentation in mmwave SDK release.   You can download and install the SDK package and you can find the top level Doygen documentation at: file:///C:/ti/mmwave_sdk_03_05_00_04/docs/mmwave_sdk_module_documentation.html

    Currently, there is no such "simple script" you are looking for.   If you need further support, please contact the local support team. 

    Best,

    Zigang

  • Hi, Vithy:

    If developing your own post processing sounds time consuming to you at this time.  You can start with SDK out of box (OOB) demo, we have one that support AOP board.  Download Ti mmwave SDK package and follow the step in TiREX to get information like: how to flash the binary and how to run visualizer: https://dev.ti.com/tirex/explore/node?node=AIHy77joqu3jXFmjqwkBKQ__VLyFKFf__LATEST

    The OOB demo designed for AOP board will be able to give you the right angle estimation.  You can check the visualizer results and place your target at different angle and position to get some understanding.   The chirp configuration for the OOB demo is also configurable through configuration file.

    Best,

    Zigang

  • Hi Zigang Yang,

    I have tried the OOB before and the reason for me to dive in to the mmWave studio was that I was not interested in elevation at all to evaluate. But, the mmWaveDemo visualiser gave me no chance neither to change the 3D scatter plot into a 2D scatter plot nor to zoom in to ±0.5m of interested range.

    I can understand that the demo has been setup to demonstrate the wider range and 3D capabilities, but in my case I am interested in very close range x direction / AOA as there is no movement in y & z direction ( y & z are at a fixed positions in the context of the piston-rod). That is why I dived in to mmWaveStudio to capture the ADC data and analyse it, at which point I got stuck with post processing.

    I am happy to start with OOB source code in CCS and fine tune the chirp parameters and capture ADC data with DCA1000 to evaluate further, if I have a means to analyse the data i.e. post process the data.

    Regards

    Vithy

  • Hi, Vithy:

    It is great that you already have some experience on OOB demo.   If you experience some limitation in OOB visualizer, you can try people counting visualizer located at  C:\ti\mmwave_industrial_toolbox_x_x_x\labs\people_counting\visualizer.  You need to download industrial toolbox from:  https://dev.ti.com/tirex/explore/node?node=AJoMGA2ID9pCPWEKPi16wg__VLyFKFf__LATEST.  And you need to unzip to under c:\ti\ directory.

    Best,

    Zigang

  • Hi Zigang,

    Thanks for you reply and I will try out the people counting visualiser.

    I am interested in obtaining the x coordinates of point cloud data of OOB demo at least at the maximum frame rate (30fps). Unfortunately, I am unable to do that with demo visualiser or I don't know how to do it.

    I am particularly looking for help to extract x coordinates of point cloud data. I hope that you will be able to point me in the right direction to achieve my objective:

    • Do I have to purchase the full Matlab license to process the data as mmWaveStudio only uses the run time engine?
    • Is there any way to analyse and plot the raw using LUA script. If so are there any application notes?

    Regards

    Vithy

    PS: As I wrote to you before I am happy to edit the OOB source code in CCS and fine tune the chirp parameters to capture ADC data with DCA1000 to evaluate further, if I have a means to analyse the data i.e. post process the data.

  • HI, Vithy:

    NO, we do not have any lua script for post processing.   And I can't answer what is the minimum MATLAB license you need, but run time engine is not enough.   

    Best,

    Zigang

  • Hi Zigang,

    I have tried the people counting visualiser and it is better in performance than the demo Visualiser and mmWaveStudio post proc. For the static boundary box it is stated that " Currently, it is recommend to keep NearY greater than or equal to 2."  Is it a limitation of the IWR6843 device? Which is not suitable for my application as I require it to be at least around 0.3.

    To overcome above restriction, can I change the values in mmWave People Counting GUI for the Radar parameters - Max Range, Range Resolutions etc. - and send the configuration would it change the chirp profile for that session or do I have to edit  profileCfg, chirpCfg and frameCfg in "AOP_6m_default.cfg"?I presume  profileCfg, chirpCfg and frameCfg are directly used by the mmWaveLink layer.

    Regards

    Vithy

  • Hi, Vithy:

    Feel free to change to your desired chirp.  Yes, you will need to change profileCfg, chirpCfg, and frameCfg in the configuration file.  You do not have to program static boundary box, and that is only something related to people counting demo and people counting tracker.  Y greater than 2m is not a limitation for device at all. 

    But you are actually using out of box demo with people counting visualizer.   

    Best,

    Zigang

  • Hi Zigang,

    Thanks.

    Where do I find the information / description on attributes or parameters of profileCfg, chirpCfg and frameCfg?

    If I have to dive in to the DSS o MSS CCS project to find out the description, could you please point me to the right header file or the c file where this information is processed.

    Regards

    Vithy

  • Hi, Vithy:

    The definition of each field for profileCfg chirpCfg and frameCfg can be found at SDK users guide located at: C:\ti\mmwave_sdk_xx_xx_xx_xx\docs\.  You need to download SDK package and install it under c:\ti\

    About the chirp design, you can find some information at: https://e2e.ti.com/support/sensors-group/sensors/f/sensors-forum/1011679/iwr6843aop-how-to-proceed-in-designing-testing-chirps

    Best,

    Zigang

  • Hi Zigang,

    I have already downloaded and installed mmwave_sdk_03_05_00_04 and looked through the doxygen\html.

    I asked the question to you as I was struggling to find any direct correlation for the profileCfg in the  "AOP_6m_default.cfg" file which has float values to the struct rlProfileCfg integer values.

    Regards

    Vithy


    AOP_6m_default.cfg

    sensorStop
    flushCfg
    dfeDataOutputMode 1
    channelCfg 15 7 0
    adcCfg 2 1
    adcbufCfg -1 0 1 1 1
    lowPower 0 0
    profileCfg 0 60.75 30.00 25.00 59.10 394758 0 54.71 1 96 2950.00 2 1 36
    chirpCfg 0 0 0 0 0 0 0 1
    chirpCfg 1 1 0 0 0 0 0 2
    chirpCfg 2 2 0 0 0 0 0 4
    frameCfg 0 2 96 0 55.00 1 0
    dynamicRACfarCfg -1 4 4 2 2 8 12 4 8 5.00 8.00 0.40 1 1
    staticRACfarCfg -1 6 2 2 2 8 8 6 4 8.00 15.00 0.30 0 0
    dynamicRangeAngleCfg -1 0.75 0.0010 1 0
    dynamic2DAngleCfg -1 1.5 0.0300 1 0 1 0.30 0.85 8.00
    staticRangeAngleCfg -1 0 8 8
    antGeometry0 -1 -1 0 0 -3 -3 -2 -2 -1 -1 0 0
    antGeometry1 -1 0 -1 0 -3 -2 -3 -2 -3 -2 -3 -2
    antPhaseRot 1 -1 1 -1 1 -1 1 -1 1 -1 1 -1
    fovCfg -1 70.0 20.0
    compRangeBiasAndRxChanPhase 0 1 0 1 0 1 0 1 0 1 0 1 0 1 0 1 0 1 0 1 0 1 0 1 0
    staticBoundaryBox -3 3 2 6 0 3
    boundaryBox -4 4 0.5 8 0 3
    sensorPosition 2 0 15
    gatingParam 3 2 2 2 4
    stateParam 3 3 6 500 5 6000
    allocationParam 40 100 0.1 20 0.5 20
    maxAcceleration 0.1 0.1 0.1
    trackingCfg 1 2 800 30 46 96 55
    sensorStart


    typedef struct rlProfileCfg
    {
           rlUInt16_t profileId;
          #ifndef MMWL_BIG_ENDIAN
          
          rlUInt8_t pfVcoSelect;
          rlUInt8_t pfCalLutUpdate;
          #else
          
          rlUInt8_t pfCalLutUpdate;
          rlUInt8_t pfVcoSelect;
          #endif
          
          rlUInt32_t startFreqConst;
          rlUInt32_t idleTimeConst;
          rlUInt32_t adcStartTimeConst;
          rlUInt32_t rampEndTime;
          rlUInt32_t txOutPowerBackoffCode;
          rlUInt32_t txPhaseShifter;
          rlInt16_t freqSlopeConst;
          rlInt16_t txStartTime;
          rlUInt16_t numAdcSamples;
          rlUInt16_t digOutSampleRate;
          #ifndef MMWL_BIG_ENDIAN
          
          rlUInt8_t hpfCornerFreq1;
          rlUInt8_t hpfCornerFreq2;
          #else
          
          rlUInt8_t hpfCornerFreq2;
          rlUInt8_t hpfCornerFreq1;
          #endif
          
          rlUInt16_t txCalibEnCfg;
          rlUInt16_t rxGain;
          rlUInt16_t reserved;

    } rlProfileCfg_t;


  • HI, 

    That is why you need to go through the user guide and search for "profileCfg" to understand each field.  And once you understand each field, you can find more description through rlProfileCfg_t.

    Best,

    Zigang

  • Hi Zigang,

    Thanks for your support.

    As this thread I originally posted for post processing has deviated into SDK direction now I will close this thread and post any new question on SDK as a separate one.

    Regrads

    Vithy