This thread has been locked.

If you have a related question, please click the "Ask a related question" button in the top right corner. The newly created question will be automatically linked to this question.

IWR6843AOPEVM: Static objects lab

Part Number: IWR6843AOPEVM

Hello,

I am using an IWR6843AOPEVM with SDK3.5 and I want to implement an application to measure garbage in a cube, similar to IWR6843: Locate static objectsIWR6843ISK-ODS: Locate static objects and IWR6843: Measurement of static objects.

My cube has dimensions of 1m x 1.5m x 1.5m (WxHxD) and for now I am working with OOB and my own parser script and configuration. My results are not as good as I want to and in the threads I linked before you talked about a lab for static detections.

In this thread (https://e2e.ti.com/support/sensors-group/sensors/f/sensors-forum/857199/iwr6843-measurement-of-static-objects) you linked to two new labs, but I am not able to reach them. Could you please refer to them again?

Best regards.

  • Hello,

    I think your use case may be slightly different than what you are trying to accomplish. But below is a link that works.
    https://dev.ti.com/tirex/explore/node?a=VLyFKFf__4.10.1&node=ACbnKrq8vr7bNqFFLaNl8w__VLyFKFf__4.10.1

    For further development, I suggest you try to look at the static Range-Angle heatmaps in the OOB demo visualizer to get a feel for how the static garbage will show up in the radar processing. This is the measurement the above Area Scanner demo is using to calculate static object detection.

    If testing with Area Scanner, make sure to adjust the profileCfg in the chirp cfg file and adjust the heatmapCfg parameter to use the nearby range bins.

    Regards,

    Jackson

  • Hello,

    thanks for your response and you suggestion, I will check this.

    1. As I set guiMonitor -1 1 0 0 1 1 1 I was able to get the TLV type 8 (Azimuth/Elevation Static Heatmap), but I for the moment, I do not know how to parse the data of this TLV type to use the data to make my own AoA processing and compute both FFT to calculate and display azimuth heat map and FFT to calculate and display elevation heat map. Do you have any parser code?
    2. So what do you mean with slightly different? I want to measure the height of waste in my cube/box named before. 

    Regards,

    Justin

  • Hi Justin,

    Please see the following document of OOB data formats. If you download the demo visualizer, you should be able to find the parser code in the source. But we do not have any text examples of parsing this. There are parsers for the pointcloud available, so you can start with this and add the TLV8 structure to parse the heatmap.
    https://dev.ti.com/tirex/explore/node?a=VLyFKFf__4.10.1&node=AH-2SVYArR7wfP9cuNOm0w__VLyFKFf__4.10.1
    "C:\ti\mmwave_sdk_03_05_00_04\packages\ti\demo\parser_scripts"

    In general, measuring accurately inside a 1m3 box will be difficult. That is not a lot of room. I suggest you also look at the level sensing labs to see if that would be a better fit, less processing, simpler results. This would give the height measurement you are looking for.
    https://dev.ti.com/tirex/explore/node?a=VLyFKFf__4.10.1&node=AJFlXiAvUzM1t86x6RKbiQ__VLyFKFf__4.10.1

    Regards,

    Jackson

  • Hey Jackson,

    yeah I already use this code and OOB data format document to parse my radar device via serial connection with Python. Please notice the following picture.

    Pointcloud in cube

    In the attached picture you can see a plot of the plointcloud (Note: I transformed the points from radarframe to cubeframe so that x and y define the floor and z represents the height). Besides some clutter and ghosts you can see some kinde of "surface" in the middle of the cube. But the results are not as good as I had hoped.

    Thank you for the suggested level sensing lab. As I noticed, it just measures the distance and no angle (just 1 Tx and 1 Rx). For my application I try to measure the 'falling edges' of my 'waste hill' - so the High Accuracy lab is not the optimal way.

    I will get in touch with the area scanner and try to parse the TLV type 8 to reproduce the Azi/Ele-Heatmaps.

    Regards,

    Justin

  • Hello,

    could you please link me to the point/code, where the Area Scanner demo is using the range-angle heatmap (data) to calculate static objects?

    I am still trying on parse the TLV type 8 from the OOB demo, but so far no success. What kind of datatype are the values of the Azimuth/Elevation Static Heatmap?

    Edit:

    For my understanding: The data of TLV type 8 are the values of the range FFT for each virtual antenna before the clutter removal and Doppler FFT, right?

    Regards,

    Justin

  • Hi Justin,

    The static heatmap and static object detection is done in the following file in the area scanner demo.

    "C:\ti\mmwave_industrial_toolbox_4_10_1\labs\common\src\dpu\staticdetproc\src"

    This uses the heatmap in a different way than the OOB demo, but the heatmap format should be the same. However, this will not be output on UART like in the OOB demo. It just comes out in a static pointcloud instead of heatmap.

    Regards,

    Jackson

  • Hey Jackson,

    thanks for your reply and the note, that the heatmap format should be the same.

    1. The heatmap is generated by the GUI (Demo Visualizer) but is calculated by using the same values as the Area Scanner use them for the static pointcloud?

    2. For my understanding: The data of TLV type 8 are the values of the range FFT for each virtual antenna before the clutter removal and Doppler FFT, right?

    Regards,

    Justin

  • Hi Justin, the heatmap is not 'generated' by the GUI, but instead by the device. The GUI just plots it for visualization. This heatmap is slightly different than the one used in area scanner since that heatmap is a comparison to the baseline. See the doc below for info on the heatmap.
    https://dev.ti.com/tirex/explore/node?a=VLyFKFf__4.10.1&node=AO7PTaT157naE8jEEoUoLg__VLyFKFf__4.10.1 

    And the TLV8 heatmap is not rangeFFT data before clutter and doppler, that would be the TLV2 range profile. The TLV 8 is a 2DFFT heatmap.

    Regards,

    Jackson

  • Hi Jackson,

    thank you for your support.

    I still have a question on this, because I am a little bit confused:

    1. W.r.t to this document https://www.ti.com/lit/an/swra554a/swra554a.pdf?ts=1648025875027 figure 9 in section 4.1 shows the 2DFFT for each antenna on which the Angle-FFT follows in the next processing step. So now, getting the values of TLV type 8 (Samples to calculate static azimuth heatmap (no moving object signal)) from my IWR6843AOPEVM, am I receiving processed data after the Angle-FTT?
    2. It would be very nice if you have some documents about the azim/elev static heatmap of TI

    3. In this thread
      https://e2e.ti.com/support/sensors-group/sensors/f/sensors-forum/915894/iwr6843isk-what-to-indicate-by-range---azimuth-heat-map
      there is a Matlab pseudocode to parser and display the data - is it similar to the output of my IWR6843AOPEVM?

    Regards,

    Justin

  • Hello Justin,

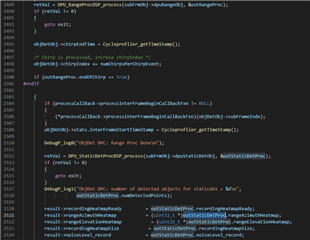
    You can see in the following code snip from objectdetect.c, that the heatmap is generated after the DSP rangeProc function and before the doppler processing.

    It seems the parsing (although it isn't fully a parser) in the linked thread above should be similar, but there may have been subtle data format changes since that post. I suggest you try it and see if the data lines up.

    Regards,

    Jackson

  • Hello Jackson,

    sorry for my late reply.
    Thanks for the information, I will try to deal with it.

    Sorry to ask again but do you have any document(s) about the heatmap and/or how the data is generated in the signal processing chain? 

    Regards,

    Justin

  • Hi Justin,

    The only information on the static heatmap is what has been linked previously. For more information on the normal heatmap generation, see the doxygen and look at the AOA proc.

    "C:/ti/mmwave_sdk_03_05_00_04/docs/mmwave_sdk_module_documentation.html"

    Regards,

    Jackson