This thread has been locked.

If you have a related question, please click the "Ask a related question" button in the top right corner. The newly created question will be automatically linked to this question.

IWR1843BOOST: Medium Range Radar: Why there is mismatch in tracked object length in GUI and log generated?

Part Number: IWR1843BOOST

I have flashed my IWR1843BOOST with Automative Toolbox 3.6.0>Labs>Medium Range Radar

Following the Tracker output generated by UI in a still indoor room.

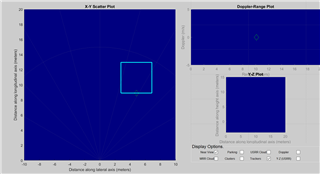
According the UI the cluster size is approximately 4m wide and 4m length (from the figure the square is the cluster detected by the sensor)

Log file is as follows

log_still_indoor_room.txt

I have also used the python based parser mmr.py mentioned in the thread AWR1843BOOST: Medium Range Radar Data from USB

According to it the parsed information is as follows

parsed.txt

{
          "header": {
            "type": 3,
            "length": 16
          },
          "body": {
            "numDetectedObj": 1,
            "xyzQFormat": 7,
            "data": [
              {
                "x": 608,
                "y": 1146,
                "xd": 12,
                "yd": -6,
                "xSize": 261,
                "ySize": 261
              }
            ]
          }

According to the parsed log generated the type 3 tlv Cluster Size is xSize and ySize is around 261 .  

How is it related to the information in GUI? I was expecting some values related to 4m in parsed information. Also is the value 261 in cm ? Where can I get more details about it?

  • Hi, 

    Thanks for sharing the information! The request is routed to our experts and they will get back to you soon. 

    Regards, 

    Sudharshan K N 

  • Thank you for considering my question, Waiting for an expert solution.

  • This log is captured as original raw data from UART interface as it is sent from MRR aplication.

    But the visualizer plot does some of the basic calculation while it is plotting on the screen, please refer the visualizer source code from the MRR package for more info.

    labs\lab0007_medium_range_radar\gui\MRRvisualization

    And you can refer MediumRangeRadar_DeveloperGuide.pdf for TLV data format info.

    Regards,

    Jitendra

  •  Hi ,

    the visualizer plot does some of the basic calculation while it is plotting on the screen

    I understand visualizer is doing some calculation, I am looking for exactly what is doing by the visualizer. Could you please share me more details on what is happening under the hood.

    According to my understanding,

    • from the raw data log from UART , TLV "data"  needs to be divided by 2^ 7 , where 7 is xyzQFormat specifed for the TLVs.
    • According to this, xSize and ySize will be 2.03 (= 261/128) But in the GUI it is around 4m lengtth and 4m width
    • I'm asking for this data mismatch , Is there any other calculation I'm missing. Please guide me 
  • Hi Asha,

    Object type is MMWDEMO_OUTPUT_MSG_TRACKED_OBJECTS (3) in above parsed data.

    If you follow dss_main.c file 

    this data maps to trackerOpFinal

    which is this structure

    typedef struct trackingReportForTx_t
    {
    int16_t x; /**< the tracking output -> x co-ordinate */
    int16_t y; /**< the tracking output -> y co-ordinate */
    int16_t xd; /**< velocity in the x direction */
    int16_t yd; /**< velocity in the y direction */
    int16_t xSize; /**< cluster size (x direction). */
    int16_t ySize; /**< cluster size (y direction). */
    } trackingReportForTx;

    So xSize and ySize if cluster size. not the Plot's max X & Y size.