This thread has been locked.

If you have a related question, please click the "Ask a related question" button in the top right corner. The newly created question will be automatically linked to this question.

AWR1243: Calibration guide

Part Number: AWR1243
Other Parts Discussed in Thread: AWR2243,

Hi Experts,

Good day. Seeking your assistance please:

From the thread, there's the calibration document and it mentioned about a script:

"a few frames of raw ADC data needs to be
collected by using the example script provided in the mmWave Studio release"

What is the absolute path to this script?

Also, this post AWR1243's calibration are more technical. Is there any tutorial guide?

Thank you.

Regards,
Archie A.

  • Hi Archie,

    Please look at scripts available at this path 

    C:\ti\mmwave_studio_02_01_01_00\mmWaveStudio\Scripts\Cascade

    You need to install mmWave Studio v2.1

    Regards,

    Jitendra

  • Hello Archie,

    If you are using a cascade system , you should be using AWR2243 device. AWR1243P is no longer supported.

    The following app note provides the technical details on how the calibration is done and how the corrections are applied. https://www.ti.com/lit/ug/tiduen5a/tiduen5a.pdf

    The lua scripts to configure the 4 chip cascade EVM are available in the mmwave studio install path : \mmWaveStudio\RunTime\Cascade_Capture

    The example matlab code to process the data is available mmwave studio install path : \mmWaveStudio\MatlabExamples

    regards,
    vivek

  • Hi Vivek,

    Thanks for the details but the customer is not using a cascaded but only a single AWR1243BOOST.

    I am posting this query on behalf of the customer:

    I just want to calibrate the single AWR1243 radar sensor board. The radar board raw ADC data does not reflect the actual scene that we are trying to capture.On Range-Angle Heatmap on mmwave Studio there are a lot of other things which appear as if the radar seems to capture.But the actual scene doesn't correspond to Range-Angle Heatmap. Is there any document/tutorial regarding this?

    Any guide to calibrate this one?

    Thank you.

    Regards,
    Archie A.

  • Hello Archie,

    What exactly are they trying to calibrate? Could you provide more details on what they are trying and what they are observing?

    Regards,
    vivek

  • Hi Vivek,

    Thanks for your guidance. See information received from Cx:

    I am trying to be sure that the radar board captures the scene correctly.Please attached images where I triggered a frame to capture a scene.The radar board is faced to the wall which is 2 meters away from the radar.As can be seen from the Matlab plots, the range-angle plot shows a weird image which doesn't correspond to the scene captured.
    So I am trying to be sure that if the AWR1243 board needs calibration.

    Thank you.

    Regards,
    Archie A.

  • Hello,

    I see that the sensor is showing multiple static objects, including the 2m wall in front. Why do they this it does not correspond to the scene?

    Regards,

    Vivek

  • Hi Vivek,

    Cx responded:

    When you look at the range-angle plot, radar is supposed to only see the wall which is 1.5-2m away from radar.
    On the range-angle plot, there are many yellow spots on the plot which are beyond 2m.
    Though we expect the radar to see only the wall.
    Because there are no other objects in sight of radar.

    The question arises about if the radar is well tuned/calibrated.
    We have doubts that the radar is not working as it is supposed to.

    Thank you.

    Regards,
    Archie A.

  • Hello Archie,

    Radar is capable of penetrating  walls and the objects beyond 2m in front could be objects present on the other side of the wall. It could also by "double reflections" caused by wall it has a very reflective material. In that case the the further objects would be exactly twice the distance of the wall.

    There are no issues with calibration that can cause this.

    regards,
    vivek

  • Hi again Vivek,

    Sorry but customer still have follow ups as:

    1. Is there any way to access the code of the Post Processing Plots?
      Range-Angle Plot etc. Is it a Matlab code which plots?
    2. Is there any way to plot the Range-Angle Plot for the range of 2m?

    Thank you very much for your continue support.

    Regards,
    Archie A.

  • Hello Archie,

    The post processing the ADC data is done in Matlab. But the source code is not available.

    You can restrict the axis in the plot , keep the range to 2m.

    regards,

    Vivek

  • Thanks, Vivek.

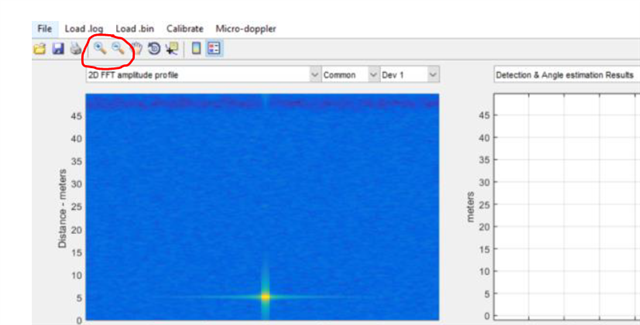
    How can we change the range of the plot to 2m? Or is there any zoom tool on the plot?

    Regards,
    Archie A.

  • Hi Vivek,

    Sorry but need to ask update on customer behalf.

    How can we change the range of the plot to 2m? Or is there any zoom tool on the plot?

    Thank you.

    Regards,
    Archie A.

  • Hello Archie,

    You can find the zoom tool in the plot , shown below (in red circle.

    Regards,

    Vivek