This thread has been locked.

If you have a related question, please click the "Ask a related question" button in the top right corner. The newly created question will be automatically linked to this question.

AWR1843BOOST: How to get data generated to plot ISAR images by AWR1843

Part Number: AWR1843BOOST
Other Parts Discussed in Thread: AWR1843, AWR2243, AWR1243, AWR1642

Hi Experts,

Good day! We need your help with our customer. Here is the full details of inquiry below.

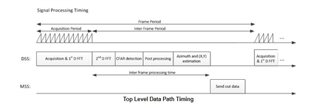
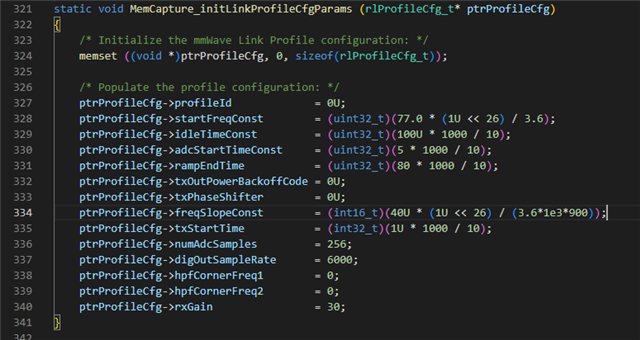
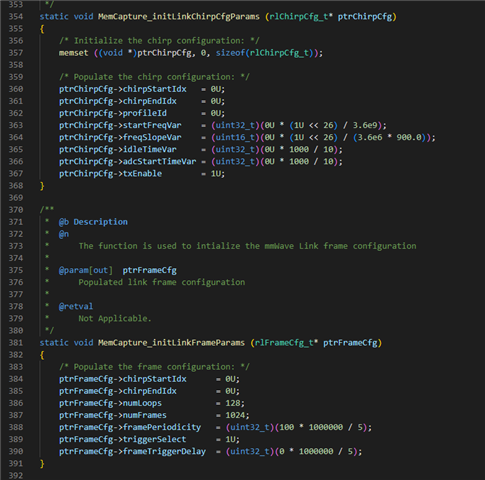
I am using AWR1843. In mmWaveSDK user guide section 5.4.19.3, it is mentioned that 

To access ADC data from mmWave sensors, user need to program various basic components within the device in a given sequence. In order to help user understand the programming model needed to configure the device and generate ADC data in device's L3 memory, an example usecase is provided under mmwave_sdk_<ver>\packages\ti\drivers\test\mem_capture. Refer to the doxygen documentation located at
mmwave_sdk_<ver>\packages\ti\drivers\test\mem_capture\docs\doxygen\html\index.html for more details.

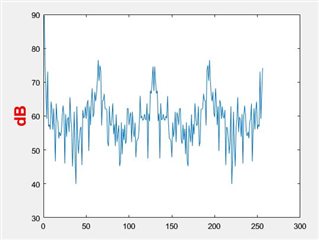
My question is "Does this L3 cache memory data can be used to get the Range-Azimuth Heatmap generated in mmWaveSDK plots Tab after we retrieve it by using above technique." 

I need to use the data that is used to generated to heatmap.  

Best regards,

Jonathan

  • Hi,

    If you have a DCA1000 capture card, it would be easier to capture and process raw data.

    The data in the documentation you mentioned includes only 1 frame of data.

    Thank you

    Cesar

  • Hi Cesar,

    Kindly please check once again. Here is the customer's feedback below.

    As far as my understanding for every frame (i.e. every time the signal is transmitted), the backscatter is collected and plotted in the selected plots. For the next frame the plot is going to change, We can observe this in the scatter plot or range profile or noise profile plots. So we have to use each frame data to get the plots corresponding to that data. Right?

    This is my understanding of the term "frame". Did I understood wrongly.

    Even if we use DCA1000 we can get the data for each frame and we have to use 1 frame data for plotting the plots. Right?

    Also I do not know what is the term "interframe" means. Kindly please explain it further. 

    Thank you in advance. 

    Best regards,

    Jonathan

  • Hi,

    Your understanding is correct. For every frame ADC data is produced. This data is processed and the detection points are generated. For every frame there is new ADC data, so the detected points will change

    The DCA1000 can be used to capture raw data for a finite number of frames using mmWave Studio tool. Then the raw data must be post processed either with the matlab integrated in Studio or with your own custom scripts

    You can download the mmWave Studio tool (for xWr1843) and review the User Guide here

    https://www.ti.com/tool/MMWAVE-STUDIO

    C:\ti\mmwave_studio_03_00_00_14\docs\mmwave_studio_user_guide.pdf

    "interframe" is the terminology used to denote the time when the sensor is not actively chirping

    The frame timing has two parts

    • Active Period (acquisition period) - this is the time when the sensor is actively receiving RF data and is sampling it to create the ADC samples
    • Inter Frame Period - this is the time when the ADC data is provided to the processing engines of the sensor and the data is being processed.

    thank you

    Cesar

  • Hi Cesar,

    Kindly please check once again. Here is the customer's feedback below.

    Does the raw data means the sampled backscatter.

    You said, then the raw data must be post processed either with the matlab integrated in Studio or with your own custom scripts.
    Does this mean can we use our own image processing algorithms (like RD or JTF motion compensation etc.) on raw the data in MATLAB software to produce images

    So, by using DCA1000 we get the raw ADC data. Does the L3 cache memory ADC data acquired is same this?

    You said L3 cache memory provides 1 frame of data. So, we can get 1 image (heatmap I require). But as DCA 1000 provides data for finite number of frames, that means can we get that many images (heatmaps I require) corresponding to that many frames or only 1 image?

    Best regards,

    Jonathan

  • Hi,

    The raw data is the sampled data received by the Rx antennae.

    The radar raw data is usually processed through FFT. We usually call this 1D, 2D - doppler FFT, 3D - angle FFT

    By processing the raw data you will be able to create the heatmap.

    The ADC data acquired is the same data but only for ONE frame.

    With DCA1000 we are able to get more frames. Each frame can be processed and a heatmap can be computed for each frame.

    Please read this white paper

    https://www.ti.com/lit/wp/spyy005a/spyy005a.pdf

    Thank you

    Cesar

  • Hi Cesar,

    Thanks for the response. 

    Could you share us on how to get the L3 ADC data, then draw a plot and could you guide us on how to rget it as told in mmWaveSDK user guide.

    Thank you once again. 

    Best regards,

    Jonathan

  • Hi,

    I am not clear what this means

    thank you

    Cesar

    guide us on how to rget it as told in mmWaveSDK user guide.
  • Hi Cesar,

    We would like to know how to get the L3 ADC data, then draw a plot. We want to use L3 data. This way we think we can plot multiple plots every time I access it. 

    Best regards,

    Jonathan

  • Hi,

    If you don't have a DCA1000 EVM available, than you could use the test_mem application to capture one frame (radar cube) of raw data.

    Please see below.

    https://e2e.ti.com/support/sensors-group/sensors/f/sensors-forum/818840/awr1642boost-sdk-3-2-how-to-use-unit-test-mem_capture

    If you have a DCA1000 EVM, then you will be able to capture a set of frames of raw ADC data.

    Thank you
    Cesar

  • Hi Cesar,

    Thank you for waitiing. Here is the customer's update below.

    I have done the following steps to capture the dat. I have some doubts.
    1. Flashed the device with 'ccsdebug.bin' from C:\ti\mmwave_sdk_03_06_00_00-LTS\packages\ti\utils\ccsdebug.
    2. Change the device to functional mode. Connected R4F core. Reset it in CCS. Uploaded MSS. Same way I have uploaded DSS into C674X core. Started R4F first, then C674X. A message appeared in CCS console. (Fig. 1)
    3. Paused both the cores. Opened memory browser.
    4. In the link Cesar sent it is said to see .map file of 'xwr18xx_mem_capture_dss' to know the starting address of DataCube. I opened it in text format. I am unable to identify the starting address of dataCube. (Fig. 2). How to Identify the starting address?
    5. I have searched with '0x20000000' which is used the link sent by Cesar. I got Fig.3, with name 'gDataCube' name at '0x20000000.
    6. I right clicked on memory browser. Pressed 'Save Memory'. (Fig. 4)

    7. I used 'TI data' in File format. Then in next step It asked for 'start address and Length'. (Fig. 5)
    8. But according to CCS user guide (Fig. 6). 'TI data' format automatically fills the target memory address and length of the data to be copied. But here i have to manually fill them. Do I need to copy the data to be saved in memory browser for this?
    9. Just for checking I used starting address '0x20000000' and for Length I specified '0x00100000' which I see after '20000000' in 'xwr18xx_mem_capture_dss.map' (Fig. 2).
    10. The file downloaded is in a '.dat' , has size 12MB. How to use it to generate heat map or other plots.

    So here are my doubts.
    1. Have I done any steps wrong. Do I need to include or modify any of the above steps for betterment.

    2. Does uploading MSS into R4F, DSS into C674X and then starting R4F first , then C674X correct?.
    3. How to know the starting address, Length of dataCube from 'xwr18xx_mem_capture_dss.map'? or do I have to use 'xwr18xx_mem_capture_mss.map' for it?
    4. How come 'TI data' format did not fill the starting address and Length automatically as it is told in CCS user guide?

    5.What format do I have to use for getting the different desired plots like heat map or range profile etc. (In CCS user guide it only mentioned what different file formats mean, not the different file formats for different plots. So I suppose every file format can produce all the desired plots. But can you suggest what file format is better for my purpose?)
    6. Most importantly How to generate different plots from the downloaded data (Fig. 7), especially 'range-azimuth heatmap'

    attachments_3.zip

    We look forward to your resolution. Thank you.

    Best regards,

    Jonathan

  • Hi,

    Before discussing the data capture details I wanted to clarify that you will need to develop the processing scripts (matlab or python) to process the data to create the range azimuth heatmap. These scripts are not provided by TI.

    gDataCube is the correct buffer to be saved. The size of the buffer is determined by the frame/chirp configuration

    It is nb_rx x nb_chirps x nb_adc_samples x nb_byte_per_sample

    usually nb_byte_per_sample = 4 (2 bytes for real part and 2 bytes for imag part)

    You will need to save the data in binary format and open the binary file in matlab or python.

    thank you

    Cesar

  • Hi Cesar,

    Here is the customer's feedback below. Thank you for checking.

    Generally the data format of sampled data is in complex and decimal form, then taken magnitude and plotted. This is how I have done when I plotted with already existing AWR1843 data in the literature.


    If I download the data in binary format. I am assuming it is in complex form because he told, (2 bytes for real part and 2 bytes for imag part).
    I can convert it to decimal form. So I have the script. I need to check whether it will work with the downloaded file.
    Ask him if this is how the scripts written?

    From 'xwr18xx_mem_capture_dss.map', I am able to get gDataCube address is '20000000'. (Fig. 1).
    But I am unbale to know the values of nb_rx, nb_chirps, nb_adc_samples values from it. Where do I have to check for these values?

    In addition to this, were the steps mentioned above were correct?

    Best regards,

    Jonathan

  • Hi,

    The frame/chirp configuration is provided in

    C:\ti\mmwave_sdk_03_05_00_04\packages\ti\drivers\test\mem_capture\xwr18xx\mss.c

    Please see  below current configuration.

    nb_rx= 1 (line 412 - rx_chan1_en is set to 1 - this means only rx1 is enabled)

    nb_chirps= 128 (lines 384,5,6)

    nb_adc_samples = 256 (line 336)

    Our support team does not know if this example supports a different configuration. Unfortunately the team that developed this example is no longer available for support.

    Thank you

    Cesar

  • Hi Cesar,

    Here is the customer's feedback.

    LIne 412 is
    ptrOpenCfg->chCfg.rxChannelEn = 2U;

    So I take nb_rx=2,

    Line 336 is
    ptrProfileCfg->numAdcSamples = 256;

    So I take 'nb_adc_samples' =256,

    But Lines 384 to 390, is

    ptrFrameCfg->chirpStartIdx = 0U;
    ptrFrameCfg->chirpEndIdx = 0U;
    ptrFrameCfg->numLoops = 128;
    ptrFrameCfg->numFrames = 1024;
    ptrFrameCfg->framePeriodicity = (uint32_t)(100 * 1000000 / 5);
    ptrFrameCfg->triggerSelect = 1U;
    ptrFrameCfg->frameTriggerDelay = (uint32_t)(0 * 1000000 / 5);

    What should I take as 'nb_chirps'?

    Also where to see the value of 'nb_byte_per_sample'?

    Best regards,

    Jonathan

  • Hi,

    This is not correct

    LIne 412 is
    ptrOpenCfg->chCfg.rxChannelEn = 2U;

    So I take nb_rx=2,

    In order to understand this configuration, you will need to review the Radar Interface Control user guide provided in the DFP release. This document provides the details about the configuration parameters.

    C:\ti\mmwave_dfp_01_02_06_03\docs\mmWave-Radar-Interface-Control.pdf

    In table 5.2 AWR_CHAN_CONF_SET_SB, you can see that a value of "2 = 0x10" means that only RX Channel 1 is enabled

    This is correct

    Line 336 is
    ptrProfileCfg->numAdcSamples = 256;

    So I take 'nb_adc_samples' =256,

    nb_chirps is computed as follows.

    Based on information below, the configuration loops 128 times for chip 0, so there are 128 chirps

    But Lines 384 to 390, is

    ptrFrameCfg->chirpStartIdx = 0U;
    ptrFrameCfg->chirpEndIdx = 0U;
    ptrFrameCfg->numLoops = 128;

    What should I take as 'nb_chirps'?

    Also where to see the value of 'nb_byte_per_sample'?

    nb_byte_per_sample is computed as follows


        ptrOpenCfg->adcOutCfg.fmt.b2AdcOutFmt           = 2U;

        ptrOpenCfg->adcOutCfg.fmt.b2AdcBits             = 2U;

    These parameters are described in

    5.2.2 Sub block 0x0082 – AWR_ADCOUT_CONF_SET_SB

    C:\ti\mmwave_dfp_01_02_06_03\docs\mmWave-Radar-Interface-Control.pdf

    NUM_ADC_BITS "2=0x10" means ADC data size is 16 bit = 2 bytes

    ADC_OUT_FMT "2 = 0x10" Complex 2x - this means Real and Imaginary part

        ptrOpenCfg->adcOutCfg.fmt.b2AdcBits             = 2U;

    Thank you

    Cesar

  • Hi Palguna,

    Here is the customer's feedback. Thank you for the response.

    Based on your info above;

    nb_rx=1,
    nb_adc_samples=256,
    nb_chirps=128,
    nb_byte_per_sample=4

    So, the length of the gDataCube buffer I have to enter is,
    nb_rx x nb_chirps x nb_adc_samples x nb_byte_per_sample = 131072 bytes

    Kindly please confirm if these are correct. 

    Also, some values from `mmwave_dfp_01_02_06_03`, which I have not installed. From mmWave DFP page (Fig. 1) it is used for AWR1243, AWR2243 only. Just for making sure,  can we rely on the values.

    Thank you for the clarification. 

    Best regards,

    Jonathan

  • Hi,

    Yes, this should be correct

    1x256x128x4 = 131072

    The DFP package includes the mmWave Link library which is also used on 16xx and 18xx devices.

    So, the information included in the DFP Radar interface Control Document applies to 16xx and 18xx devices as well

    thank you

    Cesar

  • Hi Cesar,

    Here is the customer's feedback below.

    I have used binary format to download the datacube of length in words 0x131072 . (Fig. binary.png). File Size downloaded is 4.8MB.
    I tried to open it with MATALB. It has shown (Fig. 30_12_2022_captured_data_binary.bin.png)
    How to get the plots from it?

    Best regards,

    Jonathan

  • Hi,

    The additional piece of information our support team can provide is that for each chirp the data is in sequential format.

    So, the first 256 complex samples should be the ADC samples for first chirp.

    You would need to run the fft on them and display the absolute value it. (this is the range FFT)

    If you have placed a strong reflector in front of the sensor you should be able to see a peak.

    Thank you

    Cesar

  • Hi Cesar,

    Here is the customer's update below.

    I did by taking 20*log10 of the fft of 1 to 256 samples. It came like this. I guess it is the "range_profile". How can I get the heatmap?

    Best regards,

    Jonathan

  • Hi,

    I recommend you check the documentation for the mmWave SDK oob demo to understand how the heatmap is computed.

    Here are the steps in our target code

    Step 1 perform FFT on all chirps (1D FFT - 256 point complex FFT)

    Step 2 perform FFT accross all chirps (2D FFT - 128 point complex FFT)

    The input to this 2D FFT is as follows

    (chirp1_sample1, chirp2_sample1... chirp128_sample1)

    (chirp1_sample2, chirp2_sample2... chirp128_sample2)

    ...

    (chirp1_sample256, chirp2_sample256... chirp128_sample256)

    After computing the 2D FFT, take the log2_absolutevalue and this should provide the range-doppler heatmap

    C:/ti/mmwave_sdk_02_01_00_04/packages/ti/demo/xwr14xx/mmw/docs/doxygen/html/index.html

    Thank you

    Cesar

  • Hi Cesar,

    Thanks for the update and here is the customer's response.

    I have done like he told.
    I am getting Fig.dr=100(dynamic range=100), Fig.dr=200 (dynamic range=200)

    I do not think these are range doppler heatmaps. Because when I used mmWave SDK few days before I got this data. I got figures like in Fig. Object on left, Object on right, Objects on both sides.

    I am forwarding the MATLAB code I used along with the binary data I got.

    Ask him if these are correct or I have used wrong code.
    How to draw Azimuth-range heatmap.

    attached images.zip

    Best regards,

    Jonathan

  • Hi,

    Before computing the 2D FFT, we recommend confirming that 1D FFT is correct as follows:

    1) Place a strong reflector 2-3m from the sensor.

    2) Capture the frame

    3) Compute the 1D FFT

    4) display the absolute value

    You should be able to observe a peak at the distance where the sensor is.

    If the peak is not observed, it means that the captured data is not correct

    Regarding drawing Azimuth-Range heatmap in matlab, this is beyond the scope of our support.

    Please use radar signal processing textbooks, ... to acquire this expertise.

    thank you

    Cesar

  • Hi Cesar,

    Thank you for your support.

    Here is the customer's update below:

    I have done what he has asked.
    First I have checked with the mmWave SDK app.
    With out any heatmap selected it came as Fig.1., With heat map it generated Fig. 2.

    After this I have used CCS to get the data.
    This is the data file (20_01_2023_captured_data_binary_2.bin)

    THe range profile curve came as Fig.3,
    When plotted the range-doppler heatmap it came as Fig.4 for dynamic range 30, Fig. 5 for dynamic range =100.

    As we see Fig. 4 resembles the Doppler-range plot in Fig. 1
    SO I believe using the procedure you mentioned, we are plotting Doppler-range plot, not the Range-Doppler Heatmap.
    Am I right?

    Is there any wrong in my code?

    YOu said to use Radar Signal Processing ToolBox.
    I think it only designs radar. I do not know how to plot heatmaps use this.

    All I am wanting to get is like the plots mentioned in this dataset.

    ieee-dataport.org/.../dataset-simulated-inverse-synthetic-aperture-radar-isar-images-automotive-targets

    They used AWR1843 and DCA1000 for getting the plots.
    These are Azimuth-Range heatmaps Right?

    Attached file.zip

    Best regards,

    Jonathan

  • Hi,

    Please make sure that the data that you read from the bin file in matlab is identical to the data that was captured. Check in CCS the memory window and make sure the data is the same.

    When the data is copied to matlab, make sure that the imaginary and complex values are in correct location.

    You need to make sure that these are complex values

    %plotting 1st chirp
    chirp_1=A(1:256);
    range_FFT=fft(chirp_1);
    range_FFTdB=20*log10(abs(range_FFT));

    Based on the pictures provided it seems that there are many objects in the environment.

    Is it possible to find an area that has less objects and follow the steps mentioned previously

    Before computing the 2D FFT, we recommend confirming that 1D FFT is correct as follows:

    1) Place a strong reflector 2-3m from the sensor.

    2) Capture the frame

    3) Compute the 1D FFT

    4) display the absolute value

    You should be able to observe a peak at the distance where the sensor is.

    If the peak is not observed, it means that the captured data is not correct

    Thank you

    Cesar

  • Hi Cesar,

    Thank you for waiting. Here is the feedback from the customer.

    Please make sure that the data that you read from the bin file in matlab is identical to the data that was captured. Check in CCS the memory window and make sure the data is the same.

    I checked it. For example, in the CCS memory window, the first word is showing 27B0574. in decimal, it is 41616756. But in Matlab, the first word is showing 122.

    I am exporting by clicking Save Memory, then selecting the format and word length.
    Could you ask Cesar, if am I exporting the correct way?

    chirp_1=A(1:256) % it isReal value
    range_FFT=fft(chirp_1); It is complex value
    range_FFTdB=20*log10(abs(range_FFT)); It is real value

    Also, He asked to observe a peak value at a distance of a strong reflector.
    From the FFT of the first chirp (256 samples), how can I tell where the distance of the strong reflector is?

    I am posting all the screenshots I have taken.

    4370.Attachments (2).zip

    Anechoic chamber testing will be done in a few days so that we do not get any other reflectors in the area. But I think it is the memory-saving issue.

    Thank you for your support.

    Best regards,

    Jonathan

  • Hi,

    Here is some information that may help you Save Data from Memory using CCS

    Thank you

    Cesar

    CCS Memory Save.pdf

  • Hi Cesar,

    Good day! I have to post the customer's update here. Kindly check once again.

    The steps he provided helped. I have checked that the data read from the bin file in Matlab is similar to the data in CCS Memory Browser. I have to use "fread(fid, 'int32')" instead of "fread(fid, 'int16')". Because from my pics, you see that the CCS data I have read is in 32-Bit Hex. Not 16-Bit Hex.

    For example, the first word in the memory browser is 27B057A. In decimal it is 41616762, the 11th word in the CCS browser is FB6F0241. In decimal, it is 4218356289. But in signed decimal, it is equal to -76611007. In Matlab, it is showing -76611007.

    So the data in the CCS memory browser is signed int or unsigned int?

    I got 131072 points after "fread(fid, 'int32')" Which is the word size we mentioned. After making it in the complex form I have 131072/2 = 65536 complex words.

    65536 = 256*256.
    The no_of_chirps*no_of_adc_samples=128*256=32768.
    So are we forming complex data wrong. or are we getting 2 frames of data or should I export 16-Bit Hex from the CCS memory browser, instead of 32-Bit Hex?
    Just for reference
    ptrOpenCfg->adcOutCfg.fmt.b2AdcOutFmt = 2U;
    ptrOpenCfg->adcOutCfg.fmt.b2AdcB = 2U;

    I plotted the range profile by taking 1D fft on 1st 256 samples(1st chirp). . Two peaks are observed. How can I know the distance between these two objects in the real world?

    I plotted a range-doppler plot by taking 2D FFT on whole data. I do not think it came correct. Is it? What is the dynamic range taken by mmWaveSDk range-doppler heatmap?

    All the figures are provided.

    Attachments_02_16_2023.zip

    Thank you for checking.

    Best regards,

    Jonathan

  • Hi,

    As we have discussed previously, for this configuration every sample is 16bit I and 16bit Q, so 4 bytes in total.

    Since for this configuration we have

    nb_rx = 1

    no_of_chirps = 128

    no_of_adc_samples=256

    The total memory for one frame is 128x256x4 bytes = 128Kb

    This is the size of the memory that has to be saved with CCS

    thank you

    Cesar

  • Hi Cesar,

    Kindly check the customer's feedback below. Thank you.

    Read the 16Bit Hex data. Checked it is the same as in the memory browser.

    I got 262144 points after "fread(fid, 'int16')". In the complex form, I have 262144/2 = 131072 complex words. Which is the word size we mentioned.

    But Range-Doppler Heatmap is not coming as it is showing in the mmWave SDK.
    I checked the 2D profile and 3D profile in MMWave SDK by flashing it with the demo without moving the device.

    Does the L3 data show 2D or 3D? Which one should I compare the L3 data with?

    Is it the dynamic range issue? or Am I doing the processing wrong?
    Here are the steps used by me to plot the range_doppler Heatmap

    doppler_heat(128,256)=0
    for chirp=1:128
    for sample=1:256
    doppler_heat(chirp,sample)=sig_cplx(256*(chirp-1)+sample);
    end
    end
    fft_sample=fft(doppler_heat,256,2);
    fft_chirp=fft(fft_sample,128,1);
    figure;
    imagesc(data_dB);
    colormap(jet)


    I am only reading 128*256=32768 complex words.
    What about the remaining 131072-32768=98304 complex points?
    Is it where we are wrong

    should I export in 16-bit Hex- C style or 16-bit Hex TI-style

    Both are giving the same values in MATLAB.

    7510.attachments_02_17_2023.zip

    Best regards,

    Jonathan

  • Hi,

    You should only Save 128Kb Memory with CCS. There should not be additional data

    thank you

    Cesar

  • Hi Cesar,

    Please check the customer's concern below.

    For 131072 as word size, I am getting 512kb.
    For 32768 as word size, I am getting 128kb.

    Here are the screenshots of How I am doing it.

    Attachments_02_20_2023.zip


    Are you getting 128kb for 131072 as the word size? or Is there any wrong with my steps?

    Best regards,

    Jonathan

  • Hi,

    You will need to Save 128Kb, so this would be 128/4 4-byte words

    thank you

    Cesar

  • Hi Cesar,

    You just mentioned 128/4 4-byte words.
    i.e 32k 4-byte words. = 32768 4-byte words, as word size right?

    Could you confirm whether you got the range-Doppler plot and what was the size you mentioned for it, and the file size for it?

    Thanks a lot for the clarification.

    Best regards,

    Jonathan

  • Hi,

    Yes, when you save the data with CCS, in the "Save Memory" window, "Length in Words" will be 32768

    Thank you

    Cesar

  • Hi Cesar,

    Here is the customer's feedback.

    I did take the word size as 32768. The file size is 128kb. But still not getting the range-Doppler heat map.

    As per request by our customer. Kindly help to perform the operations that you told us, and if you get the output as we thought. Then we can resolve it easily, instead of going around and around not knowing where the problem is.

    I am putting all the data and the screenshots

    20_02_2023_16bit_C_32768.zip

    Best regards,

    Jonathan

  • Hi,

    Unfortunately we are not able to provide this level of support.

    If customer does not have sufficient expertise, then they should work with a third party that has this expertise.

    Our support team only supports target code implementation. We do not provide any high level language implementation such as Matlab, Python...

    thank you

    Cesar

  • Hi Cesar,

    Could you help us one more time? here is our customer's request for confirmation. Here it is below.

    Ask Cesar that, If we buy a DCM 1000 EVM, Can we get the Range-Azimuth heatmap, plot without needing to use any further processing steps?
    I am mainly asking about the Range-Azimuth heatmap.

    Ask him to tell us with confirmation, because as the processing steps are not known, even if we buy DCM 1000 EVM, it would be useless if we can not directly get the Range-Azimuth heatmap. For example, We want to get the Range-Azimuth heatmap for generating plots as shown in Fig. 12 of https://ieeexplore.ieee.org/abstract/document/9695280.

    Best regards,

    Jonathan

  • Hi,

    DCA1000 allows to capture raw data. The raw data can be visualized with matlab integrated in mmWave Studio.

    However for custom visualization you would still need to develop your own Matlab/Python scripts.

    So, my answer is NO, with DCA1000 you will not be able to generate heatmaps similar to the ones in the ieee article without additional development

    thank you

    Cesar

  • Hi Cesar,

    DCA1000 allows to capture raw data. The raw data can be visualized with matlab integrated in mmWave Studio.

    Could you please elaborate more on how we can visualize with Matlab integrated into mmWave studio?

    Could you please tell us where exactly they are? Particularly we need examples of post-processing for getting a Range-Azimuth heatmap.

    Thank you for your usual support.

    Best regards,

    Jonathan

  • Please see "Section 22 Radar Post Processing"

    C:\ti\mmwave_studio_03_00_00_14\docs\mmwave_studio_user_guide.pdf

    You can download the mmwave studio from this link (for 1st generation parts)

    https://www.ti.com/tool/MMWAVE-STUDIO?keyMatch=MMWAVE%20STUDIO#downloads

    For more customized visualization you would need to develop custom scripts

    thank you

    Cesar

  • Hi Cesar,

    I really appreciate your support on this inquiry. Kindly refer once again to the customer's reply below.

    1) From User guide "C:\ti\mmwave_studio_03_00_00_14\docs\mmwave_studio_user_guide.pdf" I believe it is intended for "awr14xx" devices. Because it needs ".setup.json", ".mmwave.json" are used. as told in "C:\ti\mmwave_studio_03_00_00_14\mmWaveStudio\MatlabExamples\singlechip_raw_data_reader_example\readme.txt" file. Can these be obtained for awr1843 also?

    Also Section 22 of the mmwave_studio_03_00_00_1 user guide, does not explain about the post processing steps of Range-Azimuth Heatmap.

    From my analysis of Fig. 1. of "">www.ti.com/.../tidueo9.pdf and Fig. 4 of "">ieeexplore.ieee.org/.../stamp.jsp I found that we need to use CFAR algorithm after 2D FFT to obtain Range-Azimuth Heatmap.

    2) Can you please provide the CFAR steps done or
    For me to develop the CFAR algorithm, I need the parameters that are sent to AWR1843. as shown in Table I of ieeexplore.ieee.org/.../stamp.jsp. Where can I look for these in mem_capture code.

    3) where can we see the guiMonitor command in mem_capture code.

    Best regards,

    Jonathan

  • Hi,

    Unfortunately it is not possible to generate the Range Azimuth Heatmap with mmWave Studio.

    Also, it is not possible to mix the matlab postprocessing integrated in mmWave Studio with matlab processing implemented with external scripts.

    I think you will need to develop custom matlab scripts to process the data and generate what is needed.

    CFAR algorithm is already available from matlab. please check CFAR documentation in matlab.

    The mem_capture code only captured one frame of data. There was no processing performed, so there is no cfar processing.

    thank you

    Cesar

  • Hi Cesar,

    Thank you for waiting. Please refer to the customer's response below.

    What does it mean "it is not possible to generate the Range Azimuth Heatmap with mmWave Studio."
    We are able to generate "Range-Azimuth Heatmap" in mmWave SDK by selecting it in Configure section and setting frame rate =1.

    I used the code of the paper "">ieeexplore.ieee.org/.../9048939", provided in "">github.com/.../mmWave-radar-signal-processing-and-microDoppler-classification", which generated these plots using AWR162. But I am unable to generate the plots for AWR1843?

    AWR1843, is similar to the AWR1642, except with an extra transmitter and more memory.

    I believe we are having problems in taking parameters. Like num_Rx=1 for 2U, then how will num_Tx=1 for 1U in the "mss.c" file. Or not correctly estimating the word size to be mentioned, when we tried the first time.

    Please lookup the github code provided above and tell me how can we generate the same for AWR1843.

    Best regards,

    Jonathan

  • Hi,

    Unfortunately we are not familiar with the code on github. Please contact the developer of the code

    thank you

    Cesar

  • Hi Cesar,

    Thank you! Kindly help us once again. Customers need to clarify these questions below.

    1). In the "CCS Memory save.pdf", you mentioned "Do what is needed to make sure that the memory section
    we want to save to binary file is updated. For example:o Set Breakpoi, o Run Code"
    Do I need to set the breakpoint necessarily?

    2) How to know these values? fc, Fs, sweepSlope, Tc, max_value

    3. If not familiar with the code, May I know the code you use? 

    Best regards,

    Jonathan


  • Hi,

    Setting a breakpoint helps to make sure that the memory we want to copy to a file will not be overwritten by some further execution of the code.

    Do I need to set the breakpoint necessarily?

    These values are usually defined in the chirp configuration. Please see this appnote for more details.

    https://www.ti.com/lit/ml/swra553a/swra553a.pdf

    The chirp configuration can be configured either in the code that runs on the device or using mmWave Studio

    In the mem_capture application it is defined in

    C:\ti\mmwave_sdk_03_05_00_04\packages\ti\drivers\test\mem_capture\xwr18xx\mss.c

    • ptrProfileCfg
    • ptrChirpCfg
    • ptrFrameCfg

    C:\ti\mmwave_sdk_03_05_00_04\packages\ti\drivers\test\mem_capture\

    2) How to know these values? fc, Fs, sweepSlope, Tc, max_value

    Thank you

    Cesar

  • Hi Cesar,

    Thank you for your answer. Here is the update from our customer.

    I am passing the screenshots of ptrProfileCfg, ptrChirpCfg, ptrFrameCfg from mss.c
    Tell Cesar, I am having difficulty in taking values, because of notations like 1U<<26.
    Could you ask Cesar to get the values of "fc, Fs, sweepSlope, Tc, max_value" from these.

    Please help to share the code that you have used. " If not familiar with the code, May I know the code you use? " 

    Thank you so much for your usual support.

    Best regards,

    Jonathan

  • Hi,

    Could you please start a new thread for this topic?

    Unfortunately this thread has too many iterations and it is hard to keep track of them.

    Thank you

    Cesar

  • HI Cesar,

    Thank you so much for your support. We will create new thread for better tracking. 

    Best regards,

    Jonathan