Other Parts Discussed in Thread: IWR6843
Hi,
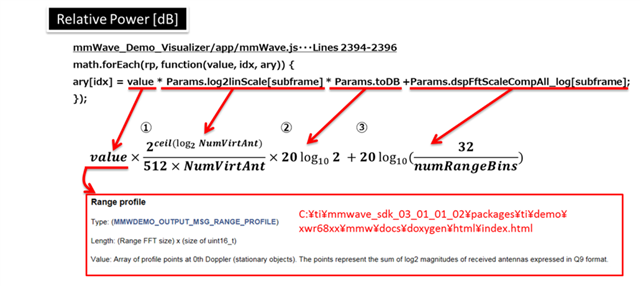
From Documentation the range profile data is represented by log2 magnitude with Q7.9 format.
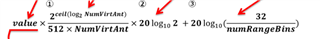
So i tried converting this to linear by : x=2^(y/512) , where y is range profile in log2 form.
Then to match the TI demo visualizer, i performed 20*log10(x) = 20*y log10(2)/512 .
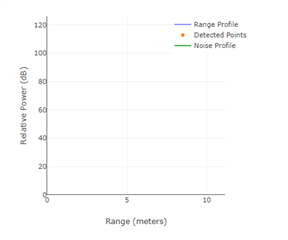
But this seemed to mismatch with Demo visualizer.
is my understanding correct or am i missing something ?