Hello,
I have been trying to plot the azimuth range heatmap from the MMWDEMO_OUTPUT_MSG_AZIMUT_STATIC_HEAT_MAP tlv in Python, I saw this thread so far explaining how to do it in Matlab, but haven't managed to translate this piece of code in python so far. I'm parsing the TLV like that :
    a = f"{int(tlv_length//4)}i"
    data = np.array(struct.unpack(a, data))
    i = data[1::2]
    q = data[::2]
    data = q
    data = data.reshape((8, 128))
and using the data variable in a similar piece of code as the one in MATLAB :
if data.shape[0] % 2 != 0:
raise ValueError("The number of rows in 'data' must be even.")
Q = data
NUM_ANGLE_BINS = np.shape(Q)[0]
theta = np.degrees(np.arcsin(np.linspace(-NUM_ANGLE_BINS/2 + 1, NUM_ANGLE_BINS/2 - 1, NUM_ANGLE_BINS) * (2/NUM_ANGLE_BINS)))
print(theta.shape)
range_bins = 1.0
posX = np.outer(range_bins, np.sin(np.radians(theta)))
posY = np.outer(range_bins, np.cos(np.radians(theta)))
xlin = np.linspace(-np.floor(np.max(range_bins)), np.ceil(np.max(range_bins)), 200)
ylin = np.linspace(0, np.ceil(np.max(range_bins)), 200)
X, Y = np.meshgrid(xlin, ylin)
QQ = fftshift(np.abs(Q))
print('posXY', posX.flatten().shape, posY.flatten().shape)
try:
Z = griddata((posX.flatten(), posY.flatten()), QQ, (X, Y), method='nearest')
except Exception as e:
print(e)
fig, ax = plt.subplots()
try:
hAzimuthHeatmapPlot = ax.contourf(X, Y, Z, cmap='jet')
except Exception as e:
print(e)
ax.axis('equal')
ax.set_xlim([-np.ceil(np.max(range_bins)), np.ceil(np.max(range_bins))])
ax.set_ylim([0, np.ceil(np.max(range_bins))])
ax.set_xlabel('Range X-Axis [m]')
ax.set_ylabel('Range Y-Axis [m]')
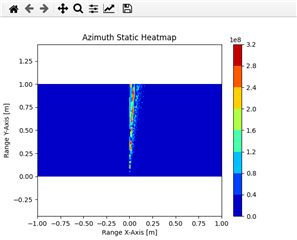
titleStr = 'Azimuth Static Heatmap'
ax.set_title(titleStr)
fig.colorbar(hAzimuthHeatmapPlot)
plt.show()
but the result wasn't the one expected and I'm having trouble understanding how to do it.