This thread has been locked.

If you have a related question, please click the "Ask a related question" button in the top right corner. The newly created question will be automatically linked to this question.

FDC2214: capacitance over time

Part Number: FDC2214
Other Parts Discussed in Thread: FDC1004

Hello John,

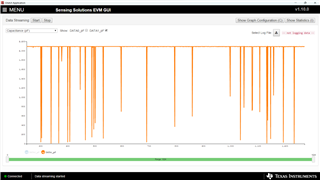
We're measuring a capacitor of about 200nF using a replica of the EVM board with own processor.
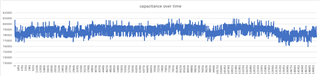
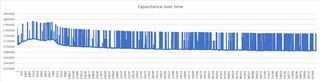
We noticed over time there is quite a fluctuation in readings. Already implemented a software floating median average algorithm of 100measurements, this is the output. It also swings a bit over time. Can you explain the swing/deviation and do you have any suggestions to get readings more stable over time? Our application is to observe fluctuations over time. We don't need a huge accuracy but stability would be required.

The image/data is logged over around 6,5hours outputting data of only channel 2 every 100ms

min 759509.6
max 810179.9
ave 787501.5
st.dev 6472.889

Looking forward to your reply, thanks.

  • Hi Marc,

    There are some tips for achieving stability in the thread below.  

    https://e2e.ti.com/support/sensors-group/sensors/f/sensors-forum/491614/fdc2214-drift-over-time 

    I also recommend that you look at your signal amplitude and ensure it is within the 1.2V to 1.8V requirement.  If your voltage is outside this range, it can affect SNR and stability.  The drive current registers can be modified to set the amplitude.  The app note below discusses this for the LDC devices, but is also applicable to FDC2214.  

    https://www.ti.com/lit/an/snoa950/snoa950.pdf 

  • Hi Eddie, thanks for your reply and references. I will check whether this improves the signal. Do you know if the standard EVM software uses any of these algorithms to stabilize the signal? If so, which?

    Secondly, in the standard EVM software I noticed a lot of downward spikes during measurement. Can this be explained from your side? Please see attached image for a 2n2 capacitor.

  • Marc,

    The EVM GUI shows the raw data.  You can also "show statistics" to show the min/max, average, and std deviation.  

    What type of capacitive sensor are you using?  Do you also have a picture of the setup?

    Please ensure that the signal amplitude is within range.  This could potentially explain the large spikes if the oscillator is not stable.

  • Hello Eddy,

    So far I'm testing with a normal ceramic cap. Later on we intent to work with larger plates to form a capacitor; are there any restrictions or practical comments you are aware of and can share with respect to this kind of larger plate applications?

    You mentioned 1,2-1,8V of amplitude is ideal and to little would not be good for the SNR. In certain cases I've mearured a amplitude of around 3,5V. Would you know if that should be avoided and we should only focus the hardware/firmware to achief the 1,2-1,8V amplitude?

    Also, how low of a frequency should be feasible?

    As for the next test for a 20nF ceramic capacitor ,we now set the amplitude to 1,4V (resonance ~3,5kHz). Down below you see the results. Can you explain the upgoing spikes or how to get rid of them?

  • Marc,

    The FDC2214 is best for measuring change in capacitance and not absolute values.  The app note below discusses capacitive sensing, although specific to the FDC1004, the principles are the same.  You may also want to consider the FDC1004 which includes active shield driver. 

    Instead of testing a ceramic capacitor, I recommend you use some copper tape in a form factor similar to your end application.  

    3.5V signal amplitude is far outside the specified range.  Undefined behavior should be expected.  

    You are also outside of the specified range for resonant frequency.  Minimum is 10kHz.  

    Please fix the frequency before I comment on spikes.