This thread has been locked.

If you have a related question, please click the "Ask a related question" button in the top right corner. The newly created question will be automatically linked to this question.

AWR2243: Samples decay in slave mode

Part Number: AWR2243

Hello,

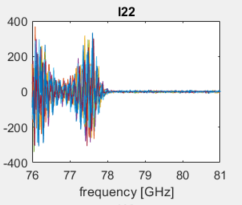
I am experiencing a similar issue to the one in the referenced post (AWR2243: Samples decay - Sensors forum - Sensors - TI E2E support forums) where the samples decay at the end of the chirp. I am using a master/slave configuration and this happens only in the slave device. 

We noticed that changing the sample rate and the chirp slope to modify the bandwidth changes the result. In particular for lower bandwidth the number of zero samples decreases. 

Do you have any insights on the reason it happens and how the choice of the parameters influences this behavior? 

Thank you,

Camilla

  • Hello,

    Can you please check the TX power, RX gain, and PMCLKLO monitors and if not, can you check these monitors? Can you also share your sensor configuration?

    Regards,

    Adrian

  • Hello,

    these are the information I got from the monitors on the RX gain and the PMCLKLO

    RXGainPhaseMonitoring: RX gain: 15, 0, 0, 20, 20, 20, 281, 268, 270, 293, 290, 279, 280, 296, 295, 285, 283, 292, 3034, 3200, 3390, 2154, 8458, 8610, 8830, 7690, 21030, 20990, 21306, 19818, 982874026, 501130717, 6627
    RXNoiseFigureMonitoring: 0, 0, 0, 566, 185, 182, 558, 548, 166, 167, 556, 574, 159, 158, 507, 6628
    IntPMCLKLOAnalogSignalMonitoring: 7, 0, 0, 0, 6629

    The configuration I am using is the following (parameters from the mmwaveconfig.txt):

    #
    #Profile config parameters, please modify if needed.
    #rlProfileCfg_t
    #
    profileId=0;
    pfVcoSelect=2;
    startFreqConst=1426063359; 
    idleTimeConst=350; 
    adcStartTimeConst=500; 
    rampEndTime=2567; 
    txOutPowerBackoffCode=2;
    txPhaseShifter=0;
    freqSlopeConst=1554; 
    txStartTime=0;
    numAdcSamples=512;
    digOutSampleRate=25000;
    hpfCornerFreq1=0;
    hpfCornerFreq2=0;
    rxGain=30;
    #END

    #
    #Chirp Configuration parameters, please modify if needed.
    #rlChirpCfg_t
    #
    chirpStartIdx=0;
    chirpEndIdx=0;
    profileIdCPCFG=0;
    startFreqVar=0;
    freqSlopeVar=0;
    idleTimeVar=0;
    adcStartTimeVar=0;
    txEnable=0;
    #END

    #
    #Chirp Configuration parameters, please modify if needed.
    #rlChirpCfg_t
    #
    chirpStartIdx=1;
    chirpEndIdx=1;
    profileIdCPCFG=0;
    startFreqVar=0;
    freqSlopeVar=0;
    idleTimeVar=0;
    adcStartTimeVar=0;
    txEnable=0;
    #END

    #
    #Chirp Configuration parameters, please modify if needed.
    #rlChirpCfg_t
    #
    chirpStartIdx=2;
    chirpEndIdx=2;
    profileIdCPCFG=0;
    startFreqVar=0;
    freqSlopeVar=0;
    idleTimeVar=0;
    adcStartTimeVar=0;
    txEnable=1;
    #END

    #
    #Chirp Configuration parameters, please modify if needed.
    #rlChirpCfg_t
    #
    chirpStartIdx=3;
    chirpEndIdx=3;
    profileIdCPCFG=0;
    startFreqVar=0;
    freqSlopeVar=0;
    idleTimeVar=0;
    adcStartTimeVar=0;
    txEnable=4;
    #END

    #
    #Frame configuration parameters, please modify if needed.
    #rlFrameCfg_t
    #
    chirpStartIdxFCF=0;
    chirpEndIdxFCF=3;
    frameCount=20;
    loopCount=4;
    periodicity=4000000; # LSB = 5ns => 20 ms
    triggerDelay=0;
    numAdcSamples=1024; 
    triggerSelect=2; 
    #END

    Do you have any insight about the results we got?

    Thanks

  • Hello,

    In your monitor the RX gain looks ok, it does not look like the RX gain is decreasing across frequency.

    The PMCLKLO monitor is reporting a '0' for the SYNC_20G_POWER which indicates it was run in single chip mode. Can you please collect this monitor data on both master and slave devices when running in cascade mode? This will help determine the 20G power at the output of the master and in the input of the slave to see if there is significant loss on the PCB that could be causing this issue.

    Also, I do not see the TX power monitor. Can you please collect this monitor on all three TX to see if there is any drop in power across frequency on the TX?

    Regards,

    Adrian

  • Hello,

    the monitors are run in cascade mode already. I select the cascade mode by changing the "cascading" parameter in the mmwaveconfig.txt file to 1 for the master and to 2 for the slave and changing the cascading pinout accordingly. Is it enough?

    I have implemented the tx monitors for the master and the slave but, for some reason that I don't understand, I have the output just for the master radar:

    TX0PowerMonitoring: 3, 0, 0, 135, 136, 129, 16664
    TX1PowerMonitoring: 3, 0, 0, 134, 135, 128, 16665
    TX2PowerMonitoring: 3, 0, 0, 130, 133, 127, 16665

    The monitors that I sent before for the RX gain and PMCLKLO are referred to the slave device. For the master I got the following ones:

    RXGainPhaseMonitoring: RX gain: 15, 0, 0, 20, 20, 20, 269, 242, 256, 259, 258, 264, 271, 271, 239, 286, 286, 290, 11180, 958, 2778, 1588, 15442, 6434, 8092, 6322, 22270, 19284, 20550, 18146, 399845789, 366343549, 16601
    RXNoiseFigureMonitoring: 1, 0, 0, 174, 211, 194, 196, 186, 185, 181, 186, 203, 158, 159, 160, 16602

    IntPMCLKLOAnalogSignalMonitoring: 7, 0, 0, 0, 16603

    Regards,

    Camilla

  • Hello,

    Ok, I am not sure why the LO power is not showing in the monitor but I think it doesn't matter. From the RX gain and TX power monitors it can be seen that the gain is flat across temps for both the TX and RX. This indicates that at the device pin there is no drop in power as frequency/bandwidth increases, which would indicate that the issue could be at the antenna (either antenna design or BGA to PCB transition design). Is this a custom antenna design? Do you have simulations across frequency with our HFSS package model and your antenna design? What is the stackup you are using?

    Regards,

    Adrian 

  • Hello,

    in the end I was able to get the TX monitor also for the slave and the power at the SYNC_IN pin, these are the results:

    TX0PowerMonitoring: 3, 0, 0, 139, 139, 129, 7683
    TX1PowerMonitoring: 3, 0, 0, 139, 138, 129, 7683
    TX2PowerMonitoring: 3, 0, 0, 143, 143, 131, 7684
    TX0BallBreakMonitoring: 1, 0, -101, 7684
    TX1BallBreakMonitoring: 1, 0, -119, 7684
    TX2BallBreakMonitoring: 1, 0, -114, 7684
    IntPMCLKLOAnalogSignalMonitoring: 7, 0, 0, -3, 7622

    No, the antenna is not custom, but we use a custom PCB. I didn't run simulations across frequency with this package, where can I find it?

    For reference I add the plot of the samples that we have with respect to frequency:


    Do you have any explanations or some suggestion on the reason of this behavior?

    Thank you

    Regards,

    Camilla

  • Hello,

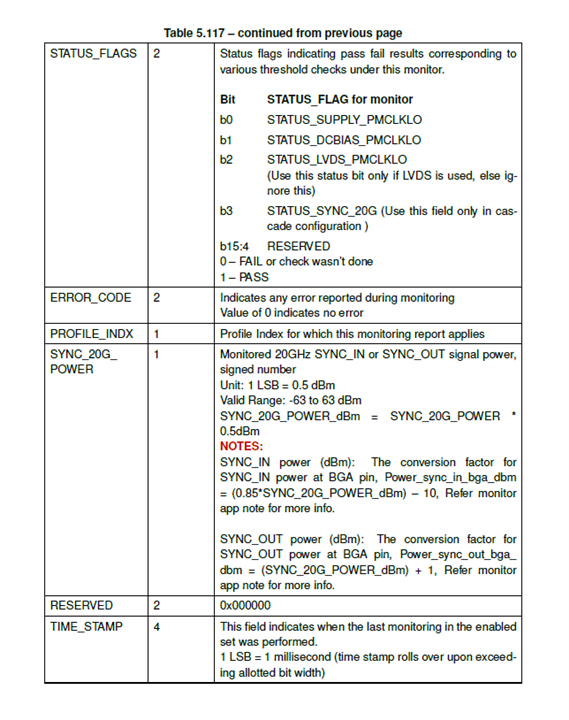
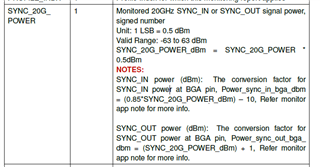
    The PMCLKLO monitor is measuring a value of -3, which if we apply the conversion this comes out to ((-3*0.5)*0.85)-10 = -11.275dBm power at the SYNC_IN ball. 

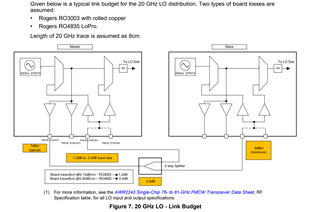
    We can see below that the device requires >= -6dBm at the pin to function properly.

    You mention that this is a custom PCB, what is the stackup you are using? The antenna and 20GHz routing require Rogers laminate to minimize losses on the PCB. With Rogers 3003 you will see 0.15dB/cm of losses for the 20GHz routing. If you are using an FR4 stackup or excessively long routing for the 20GHz LO the losses will be too large.

    Regards,

    Adrian

  • Hi, 

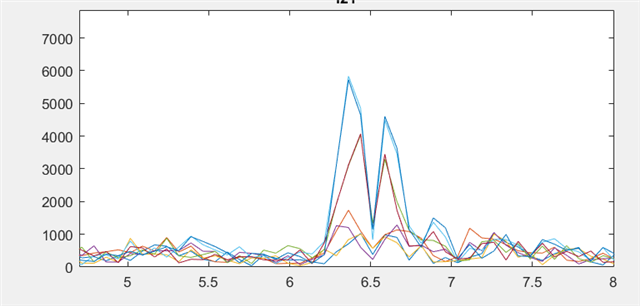
    I now measure 19 on the CLK monitor (-1.9 dBm at the pin) which means that the power level is no longer an issue. However, when collecting data I see a frequency nonlinearity. More precisely instead of having a single peak for a corner reflector I see two peaks as in this figure.

    Do you know from where it could come from?

    Regards,

    Camilla

  • Hello,

    What do these peaks correspond to in terms of frequency?

    Does this mean that the sample decay issue is resolved? If so, what was the issue?

    Regards,

    Adrian

  • Hello, the issue is partially solved. The problem was the power at the sync in pin which was too low. But now this nonlinearity showed up.

    In terms of frequency the starting frequency of the chirp is 76 GHz and we are using 2 GHz of bandwidth. The x-axis in the figure is in meters and that is the position of a corner reflector. The issue presents for all peaks, for example similar shapes are obtained from the reflections of the wall. 

    Moreover if we use the bandwidth from 77GHz to 81 GHz the time samples present an envelope.