Tool/software:
Hi all,
For the past few days, I am facing some issue while understanding the data produced by DCA1000EVM and AWR2243B.
I got the output graph after running the mmwave studio 03.00.00.14 and I am able to understand that.
But I want to produce my own plots.
For that I used the Matlab code named rawdatareader stored in "C:\ti\mmwave_studio_03_00_00_14\mmWaveStudio\MatlabExamples\singlechip_raw_data_reader_example\rawDataReader.m" and got the 2 files named Radarcube and adcdata. What is the significance of adcdata file?
For the Radarcube data, I am unable to understand what type of data is stored inside the radarcube.data file. Is it the FFT signal or the raw data captured? When I open it in matlab I get 8 columns of 128*4*256 complex single numbers.
I tried to read the mmwave studio userguide to understand the data and I was not able to properly understand this.
As far as I understood, the data stored in radarcube.data contains three-dimensional array of size SamplesPerChirp * NumRecievers * NumChirps.
I want to know if these data produced after using the script named rawdatareader is already FFT data or I have to do FFT on each of these data stored in the radarcube.data.(if so then how?)
I was also trying to do FFT on these data, but I got complex number after applying FFT on complex data but the FFT graph shown in the plot after using the mmwave studio was real.
I also wanted to know about where can I get the timestamps for the obtained data.
Is there any script/matlab code to produce the FFT data directly from the adc_data.bin. If so then please share.
Also please help me on how to get FFT data from each chirp of 8 frames just like we obtain in the mmwave studio.
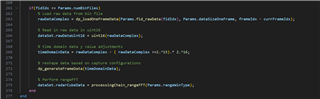
I am sharing my code which I was using in order to separate the data and apply fft.
Please help me in this regard.
Thanks and regards,
Niladri


for i=1:radarCube.dim.numFrames
    y=radarCube.data{1,i}(:,4,:);
end
size(y);

% y1=radarCube.data{1,1}(:,4,:);
% y2=radarCube.data{1,2}(:,4,:);
% y3=radarCube.data{1,3}(:,4,:);
% y4=radarCube.data{1,4}(:,4,:);
% y5=radarCube.data{1,5}(:,4,:);
% y6=radarCube.data{1,6}(:,4,:);
% y7=radarCube.data{1,7}(:,4,:);
% y8=radarCube.data{1,8}(:,4,:);

% for i=1:radarCube.dim.numRangeBins
%     ynew1=y1(:,4,i)
% end


ynew=y(:,:,1);
ynew1=fft(ynew);
y_real=real(ynew1)
y_imag=imag(ynew1)
hold on
plot(time,y_imag)
plot(time,y_real)

% ynew2=y(:,:,2);
% ynew3=y(:,:,3);
% yreal1=real(ynew1);
% yimag1=imag(ynew1);
% yreal2=real(ynew2);
% yimag2=imag(ynew2);
% yreal3=real(ynew3);
% yimag3=imag(ynew3);
time=linspace(0,2.5*10e-6,128);
% %t=time'
hold on
% plot(time,yreal1)
% plot(time,yimag1)
% plot(time,yreal2)
% plot(time,yimag2)
% plot(time,yreal3)
% plot(time,yimag3)