Other Parts Discussed in Thread: AWR1443
Tool/software:
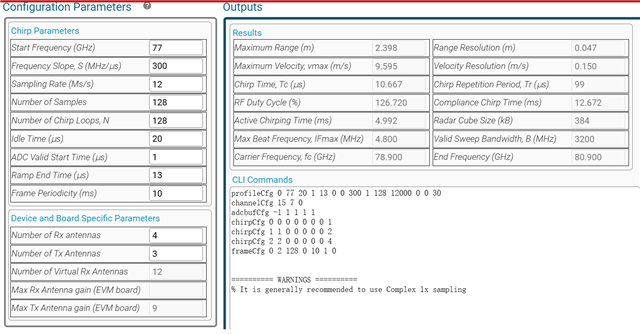
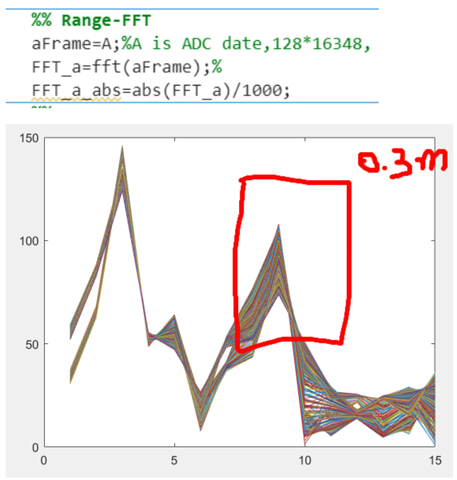
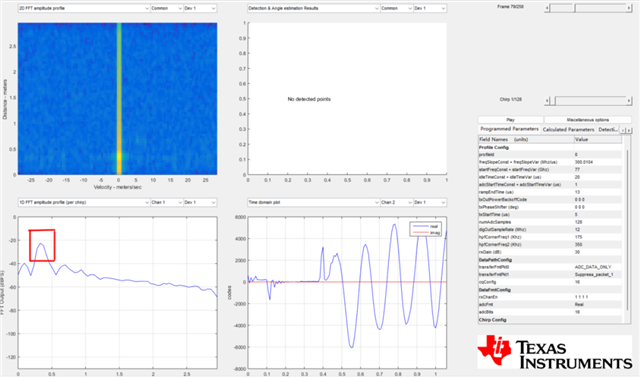
AWR1443 Parameter configuration: adcnumber: 128, frame: 128, chirp: 128. Objects position: about 0.3m
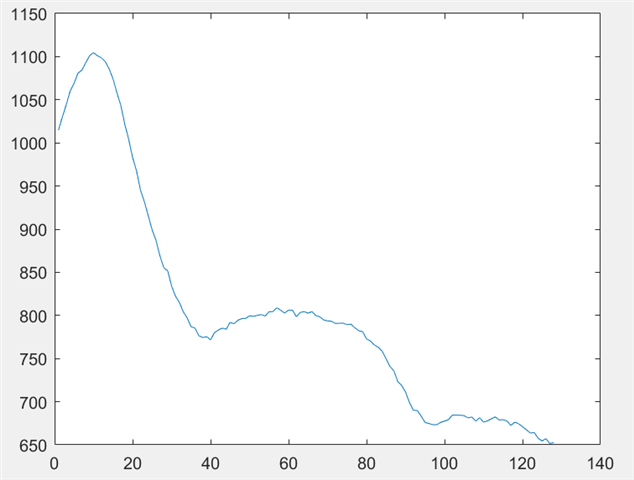
After performing range-FFT of the ADC sampling data, I select the i th chirp data of each frame (1 <i <128) to obtain the corresponding Am-range plot. However, I found a problem that the FFT peak (0.35m) was not consistent, and I looked at the peak of all chirp in all frames, showing the pattern of the peak declining with the number of frames. I selected one of the data sets of drawing. Figure 1 represents the peak change for the No.128 chirp data per frame. Table 1 shows the specific numerical values. Problem: I think the FFT peak represents the energy intensity of the echo signal. For a stationary object, the range-FFT results (range-peak) of all frames processed by a collected bin file should be the same, at least without drastic change, but the experimental results are obviously wrong. Why are the FFT peaks inconsistent in different frames?