Other Parts Discussed in Thread: MMWAVEICBOOST, , AWR6843
Tool/software:
this is continuation of previous thread raised.
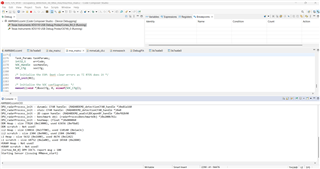
Test case 1:
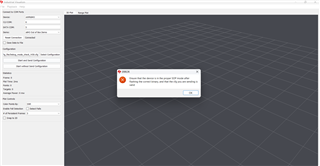
As suggested " memory is allocated in the linker.cmd and with "Optimization level -off on both MSS and DSS,able to build without any error. but when we try to send configuration Via industrial Visualizer, we are getting the following error :
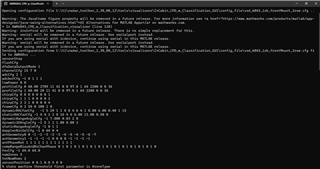
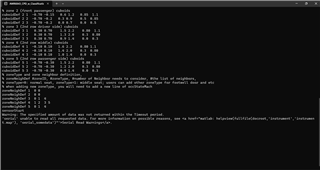
Test Case 2( No break point set inside the code ): default Optimization level -3 on both MSS and DSS, able to build without any error. We are able to send configuration Via industrial Visualizer, but code get stuck like shown in the Below console
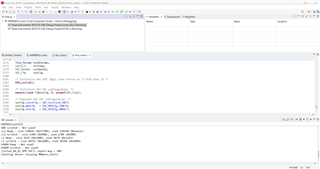
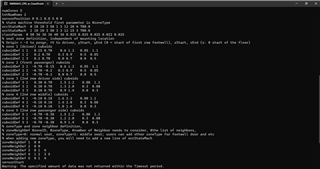
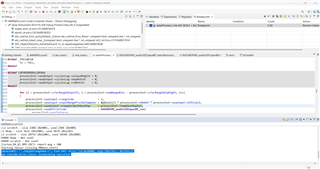
Test Case 3( break point set inside the code(ref console) ): default Optimization level -3 on both MSS and DSS, able to build without any error. We are able to send configuration Via industrial Visualizer, but code get stuck like shown in the Below console and throw error)
Please check all the three test cases (1,2&3) and give the solution.
Regards,
Mani