Other Parts Discussed in Thread: UNIFLASH, IWR1642,
What diagnostic questions can determine the root cause of the issue?
PC Setup:
* Chrome Browser Installed: dev.ti.com/mmWaveDemoVisualizer
* TI Uniflash,
* TI mm-Wave TI SDK 2.0.0.4,
* TI mm-Wave industrial toolbox 2.5.1
* MATLAB Runtime 20117a (v9.2)
Hardware: IWR 1642 Integrated Circuit is labeled:
IWR1642
QG
82ZC59
502AC ABL G1
Link indicates IWR1642BOOST ES2.0 hardware: e2e.ti.com/.../716568
Steps Taken:
- Flashed OOB Demo: C:\ti\mmwave_sdk_02_00_00_04\packages\ti\demo\xwr16xx\mmw\xwr16xx_mmw_demo.bin
- Followed Procedure Video: training.ti.com/mmwave-sdk-evm-out-box-demo
- Additional Reference: http://ti.com/lit/SWRU529
- Initial observations and screenshots: e2e.ti.com/.../717129
- Can someone interpret the console messages and provide a reference for interpretation (please to respond in that thread)?
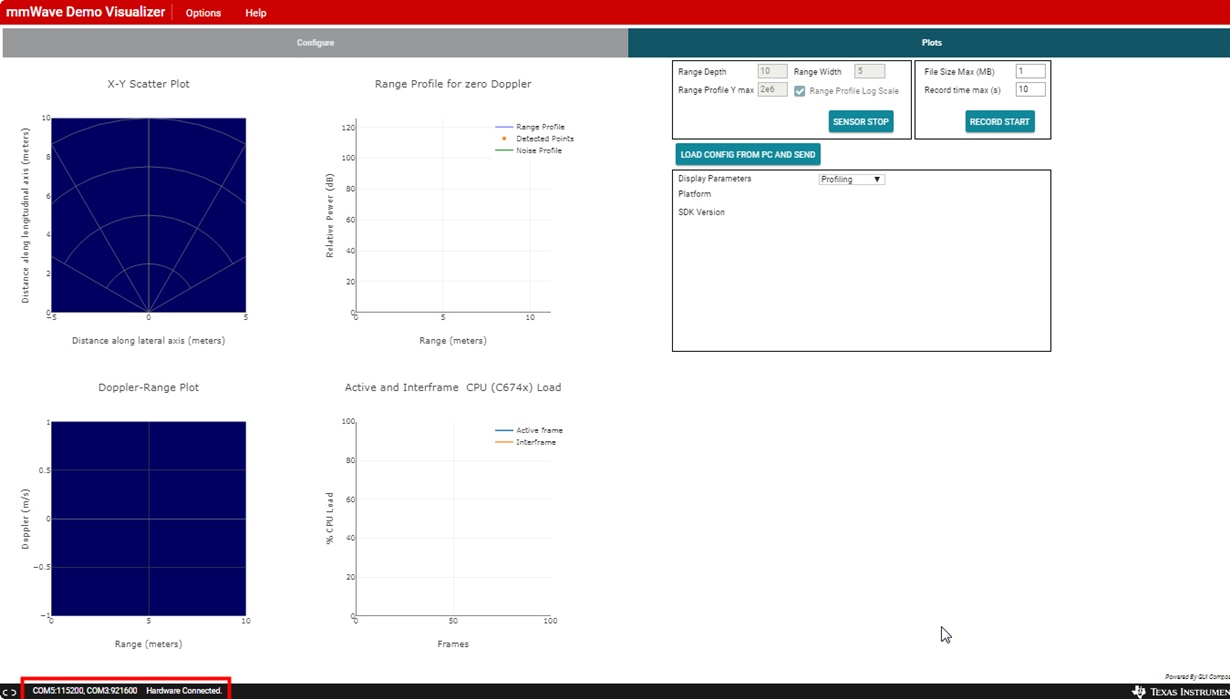
- Demo Visualizer indicates the EVM is connected (bottom left corner), however, the visualizer is not showing any data. A can was placed in front of the antenna as shown in the video.
The goal is to successfully run the OOB demo: I am seeking diagnostic questions and proedures to identify the root cause of why data is not visualized. I look forward to good questions and actionable diagnostic responses.


