This thread has been locked.

If you have a related question, please click the "Ask a related question" button in the top right corner. The newly created question will be automatically linked to this question.

TIDEP-01012: The circle shape after post-processing on RA heat map

Part Number: TIDEP-01012
Other Parts Discussed in Thread: AWR2243

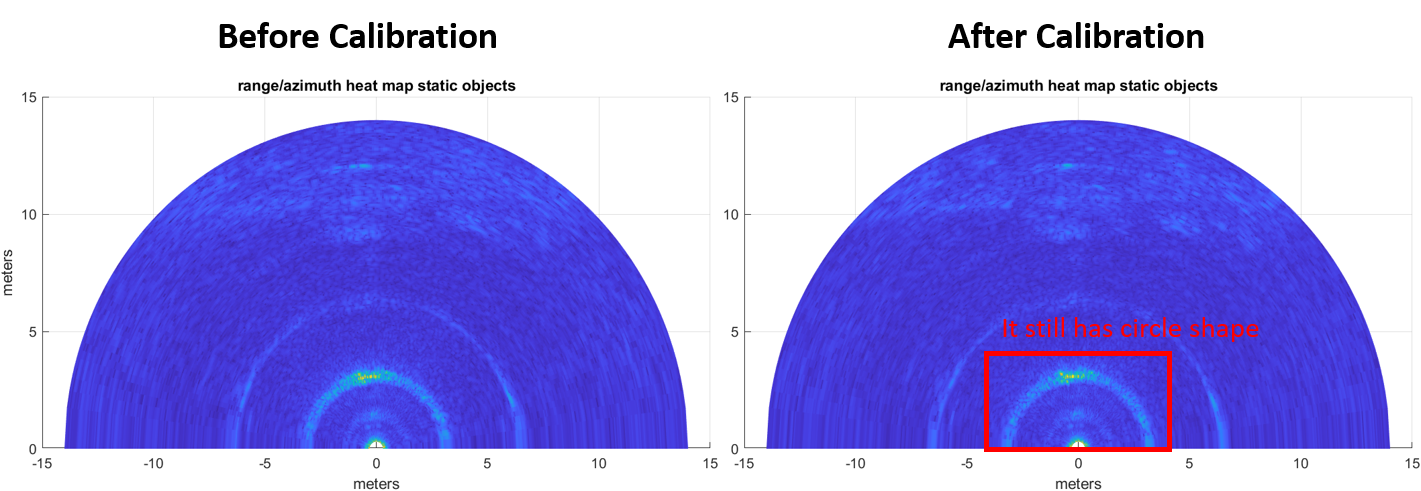
Hi, I used the AWR2243 cascade radar to capture raw data of the bike in MIMO mode.

The LUA scripts I used are "Cascade_Capture.lua" and "Cascade_Configuration_MIMO.lua" in mmWave Studio 03.00.00.07.

After post-processing with "cascade_MIMO_signalProcessing", there is a obvious circle shape near the object on the RA heat map. (as figure below)

Why does it happen and can we eliminate the circle shape? how?

Thank you for your help.

  • Hello,

    That is the Tx antenna to Rx antenna coupling showing up close to setup.

    You need to calibrate the device, mmwave Studio Matlab script provide the script and user guide explains the steps

    4chip_cascade_MIMO_example\modules\calibration


    Regards,

    Jitendra

  • Hi, Jitendra

    According to 8.3.2.2 Calibration section in the cascade user guide, I have calibrated the device with a corner reflector at 5 meter.

    After post-processing, it still has circle shape on the RA heat map. 

    Is there another way to eliminate the circle shape?

    Thanks,

    Randy

  • Hi user6346307, 

    I am discussing this with our systems to get the best answer for you. It will take me a few days to get back to this thread. 

    Thank you,

    -Randy

  • Hi user6346307, 

    There are two primary issues which might be at play here. 

    1) Our example Matlab angle FFT function currently does use any windowing. Adding windowing may help keep these angle FFT side-lobes down. 

    2) If you can plot the angle FFT separately for this target? After a good calibration you should see about 13dB offset from the peak to the side-lobes. If you see less separation than that, the initial phase calibration might need to be redone to get a more accurate calibration. Because there is little difference in the before and after calibration results, I suspect this might be the case. Can you take a look at the output graphs from the calibration scripts and post it here? 

    Thank you,

    -Randy