Hi,
Please help with the questions below:
Testing environment:
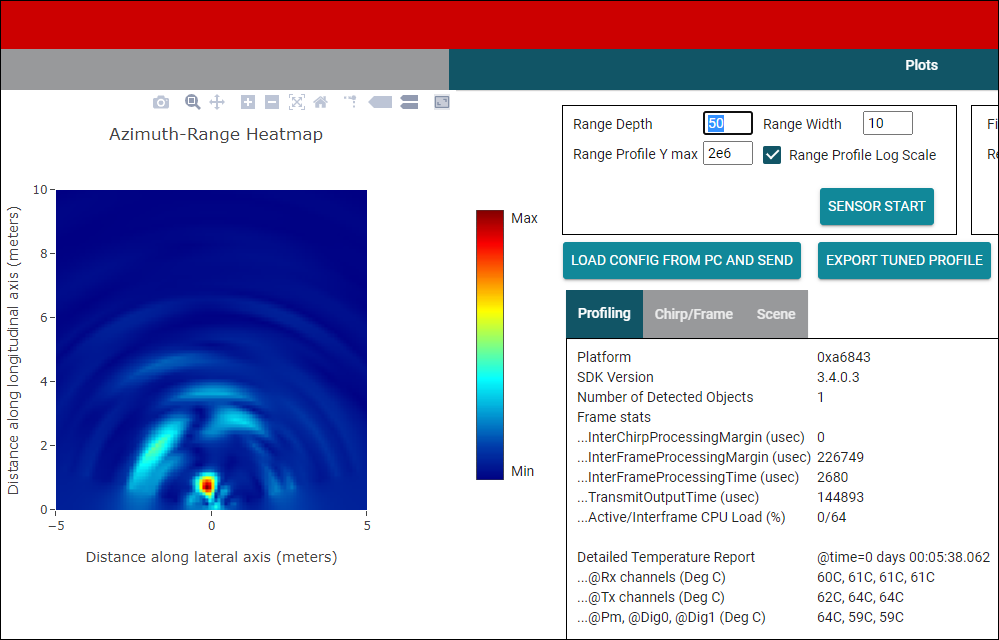
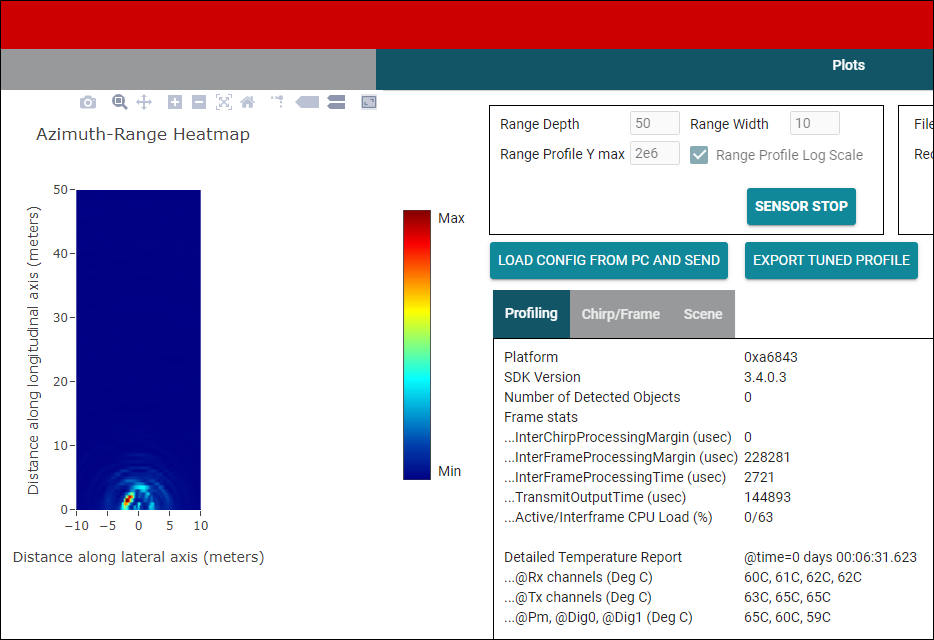
IWR6843AOPEVM ES2.0
mmWave Demo Visualizer V3.4.0
Question:
1, Scatter Plot of Plot tab is 3D. Is there a way to set it to 2D?
2. Is there a way to convert the ".dat" file obtained by recording the results into a format that can be directly observed?
(I checked a similar question on this forum before. but it didn't support for IWR6843AOPEVM, so I asked again.)
BR,
Fumikatsu