This thread has been locked.

If you have a related question, please click the "Ask a related question" button in the top right corner. The newly created question will be automatically linked to this question.

AWR1642BOOST: Short range radar demo in CCS debug mode failed when ran srr_visualization.exe

Part Number: AWR1642BOOST
Other Parts Discussed in Thread: AWR1642

Hi,

I am using AWR1642BOOST EVM with ES2.0 chip. My desktop computer is with 64-bit Windows 10. The softwares are CCS 7.4.0, mmwave SDK 2.0.0.4, Matlab Runtime2017a(9.2), and TI mmwave automotive toolbox 3.1.0. I am following the steps as given in AutoSrr_usersguide.pdf.

I can run the demo well using the "Quick Start" part of AutoSrr.pdf i.e using the srrdemo_16xx.bin located at C:\ti\mmwave_automotive_toolbox_3_1_0\labs\lab0002_short_range_radar\prebuilt_binaries . The demo runs fine.

Then I did the "Rebuild" process as per the "Developer's Guide" part of the document AutoSrr.pdf. I did not make any change in the  code.

I had flashed the image  xwr16xx_ccsdebug.bin  located at  C:\ti\mmwave_sdk_02_00_00_04\packages\ti\utils\ccsdebug .After that I removed the SOP 2 jumper. Now the EVM only has jumper at SOP0.

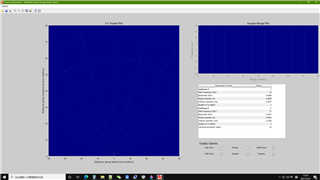
Then opened CCS, launched a target configuration for AWR1642, connected the Group 1 ( as per AutoSRR.pdf), loaded the DSS and MSS executables(.xe674 and .xer4f), and then ran the Group 1. These all processes went well. Then, I ran the srr_visualization.exe located at C:\ti\mmwave_automotive_toolbox_3_1_0\labs\lab0002_short_range_radar\gui . The SRR Visualizer output window appeared and I only changed the "UART port options" to the COM port numbers in my computer. Then the SRR Demo window appeared but i can’t see any targets,and the Console displayed error:
I searched e2e forum, find  a solution in

https://e2e.ti.com/support/sensors/f/sensors-forum/886201/ccs-awr1642boost-automotive-toolbox-2-9-1-short-range-radar-lab-not-working-in-ccs-debug-mode

I tried the method mentioned in this post.  Ungroup the DSS and MSS cores. Then as individual cores, launch the DSS first and the MSS core. It still failed and the same error occurred. The GUI has no targrts and the console as follows:
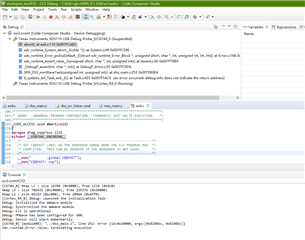
[C674X_0] Heap L1 : size 16384 (0x4000), free 1216 (0x4c0)

Heap L3 : size 786432 (0xc0000), free 229376 (0x38000)

Heap L2 : size 49152 (0xc000), free 20464 (0x4ff0)

[Cortex_R4_0] Debug: Launched the Initialization Task

Debug: Initialized the mmWave module

Debug: Synchronized the mmWave module

Debug: CLI is operational

Debug: MMWave has been configured for SRR.

Debug: Sensor will start momentarily.

[C674X_0] {module#8}: "../dss_main.c", line 252: error {id:0x10000, args:[0x8108bc, 0x8108bc]}

xdc.runtime.Error.raise: terminating execution

Could you please advise and guide me to solve this problem  in CCS debug mode ?Thank you very much!

  • Hi,

    Could you disconnect DSS core after you load image and execute that core?

    When CCS is connect to any core, it may continuously checking that MSS/DSS memories to updated debug variables, which might cause some delay to actual application execution. Error you are getting in dss_main.c is due to chirp/frame processing is not being done within pre-defined time. CCS connection to core might be the reason. Thus, try disconnecting the DSS (but execute MSS core first then DSS core after image load) then run visualizer*.exe.

    Regards,

    Jitendra

  • Hi Jitendra,

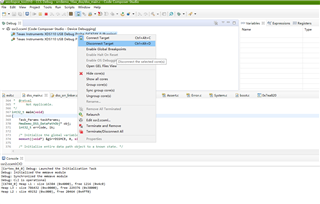
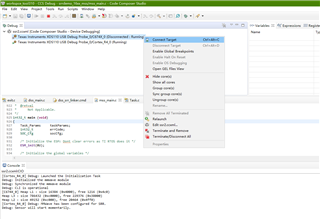
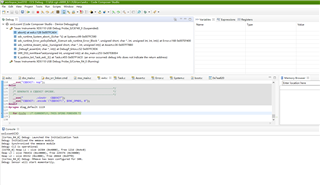
    I tried your advice. After loading image(.xe674 and .xer4f), I executed MSS core first and then DSS core. Then I disconnected DSS core as follows(figure 1), and ran srr_visualization.exe. The GUI still showed no targets(figure 2). I tried reconnected DSS core then(figure 3), and the state of DSS core is as figure 4.

    Did I operate it right?  

  • Hello,

    Let me forward this thread to one of my colleague to help you.

    Regards,

    Jitendra

  • Hi,

    Thank you and look forward to your reply. 

  • Hi,

    Sorry for the delay in my response. Is using toolbox 3.1 essential? I have just tested the SRR lab in toolbox 3.2 with CCS debug binary flashed on the device from SDK 3.5.

    The error you see can sometimes occur in CCS debug mode operation if the cores need to be started in a particular order, and you don't follow that order (this behavior isn't very well documented). However, I just checked, for the SRR lab in toolbox 3.2, both running the MSS before DSS and running DSS before MSS should work fine. All you have to do is ensure you use the GUI after both cores are running. Grouping the cores and running them together also didn't cause any issues on my end (this is generally how the developer guides recommend you run CCS debug binaries).

    Please let me know if you encounter the same problem with toolbox 3.2. With toolbox 3.1, perhaps running the MSS, then the DSS and then the GUI could resolve this issue too (I can see from the debug output that in your case DSS was started before MSS).

    Regards,

    Aayush

  • Hi,

    Really appreciate for your great help! I checked the SRR lab in toolbox 3.2 with SDK 3.5.04, and the GUI runs fine. This problem is resolved. Thanks again for your patience and help!

    Regards