This thread has been locked.

If you have a related question, please click the "Ask a related question" button in the top right corner. The newly created question will be automatically linked to this question.

CCS/AWR1642BOOST: automotive toolbox 2.9.1 Short Range Radar Lab not working in CCS debug mode

Part Number: AWR1642BOOST
Other Parts Discussed in Thread: UNIFLASH, AWR1642

Tool/software: Code Composer Studio

Hi,

I am using AWR1642BOOST EVM with ES2.0 chip. I am using a laptop with 64-bit Windows 10 Pro. I am using CCS 8.2.0, mmwave SDK 2.0.0.4 and TI mmwave automotive toolbox 2.9.1 is installed. I am following the steps as given in AutoSrr.pdf  (Short Range Radar user Guide).

I am able  to run the lab well using the "Quick Start" part of AutoSrr.pdf i.e using the prebuilt binary ( srrdemo_16xx.bin )  at location C:\ti\mmwave_automotive_toolbox_2_9_1__win\mmwave_automotive_toolbox_2_9_1\labs\lab0002_short_range_radar\prebuilt_binaries . The demo runs fine and following is an example screenshot.

Then I did the "Rebuild" process as per the "Developer's Guide" part of the document AutoSrr.pdf. I did not make any change in the  code yet, I am just trying to make myself familiarize with the process as I am new to CCS. I imported the project and rebuilt the binaries as per instructions and it went well. I further followed the instruction to load the binaries and  it also seemed to go well. In this process, I had flashed the metaimage file   xwr16xx_ccsdebug.bin   located at  C:\ti\mmwave_sdk_02_00_00_04\packages\ti\utils\ccsdebug .

After that I removed the SOP 2 jumper that I had put in place for using UNIFLASH to flash the above metaimage on the device.

Now the EVM only has jumper at SOP0

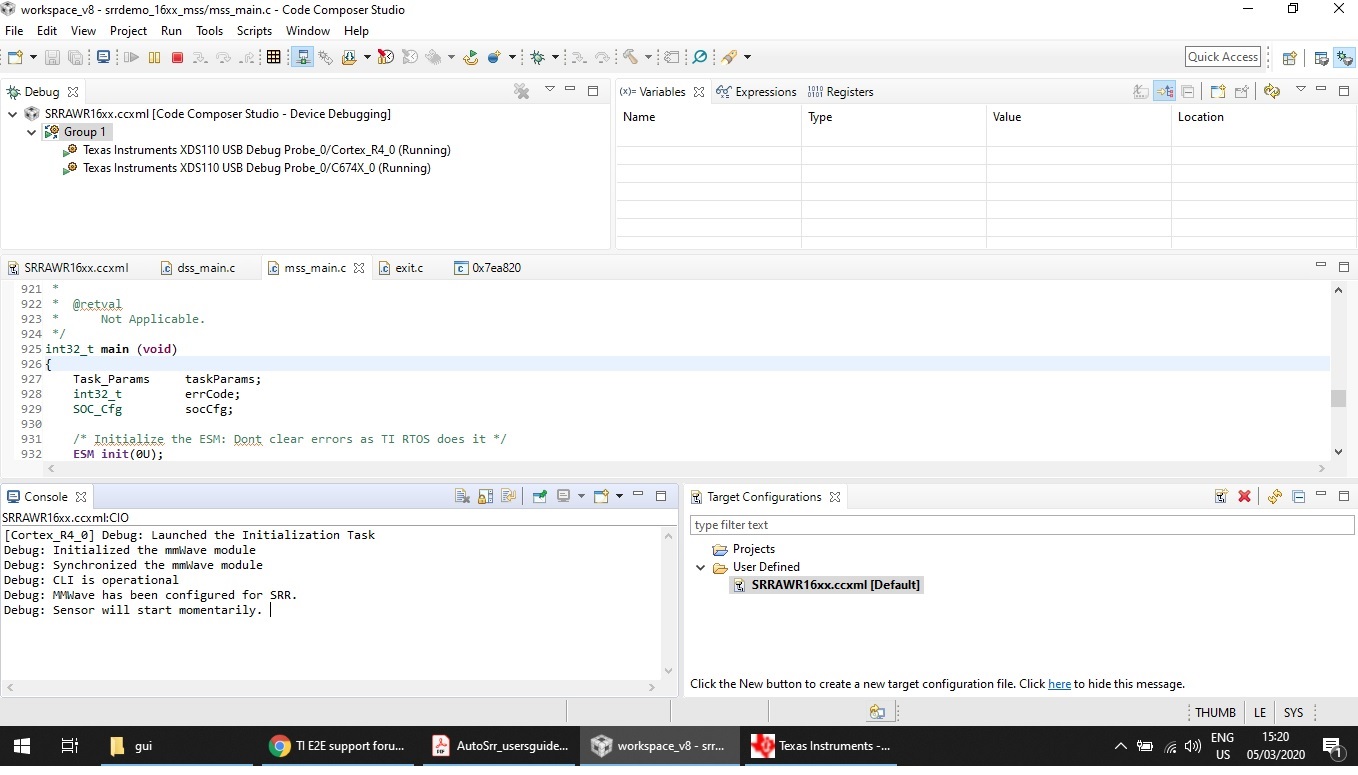
It seemed to work well when I connected the target using CCS and when I ran the Group 1 ( as per AutoSRR.pdf). I got the following output at CCS Console :

[Cortex_R4_0] Debug: Launched the Initialization Task
Debug: Initialized the mmWave module
Debug: Synchronized the mmWave module
Debug: CLI is operational

Then, I ran the exe titled srr_visualization located at C:\ti\mmwave_automotive_toolbox_2_9_1__win\mmwave_automotive_toolbox_2_9_1\labs\lab0002_short_range_radar\gui . The following two additional lines appeared in CCS Console

Debug: MMWave has been configured for SRR.
Debug: Sensor will start momentarily.

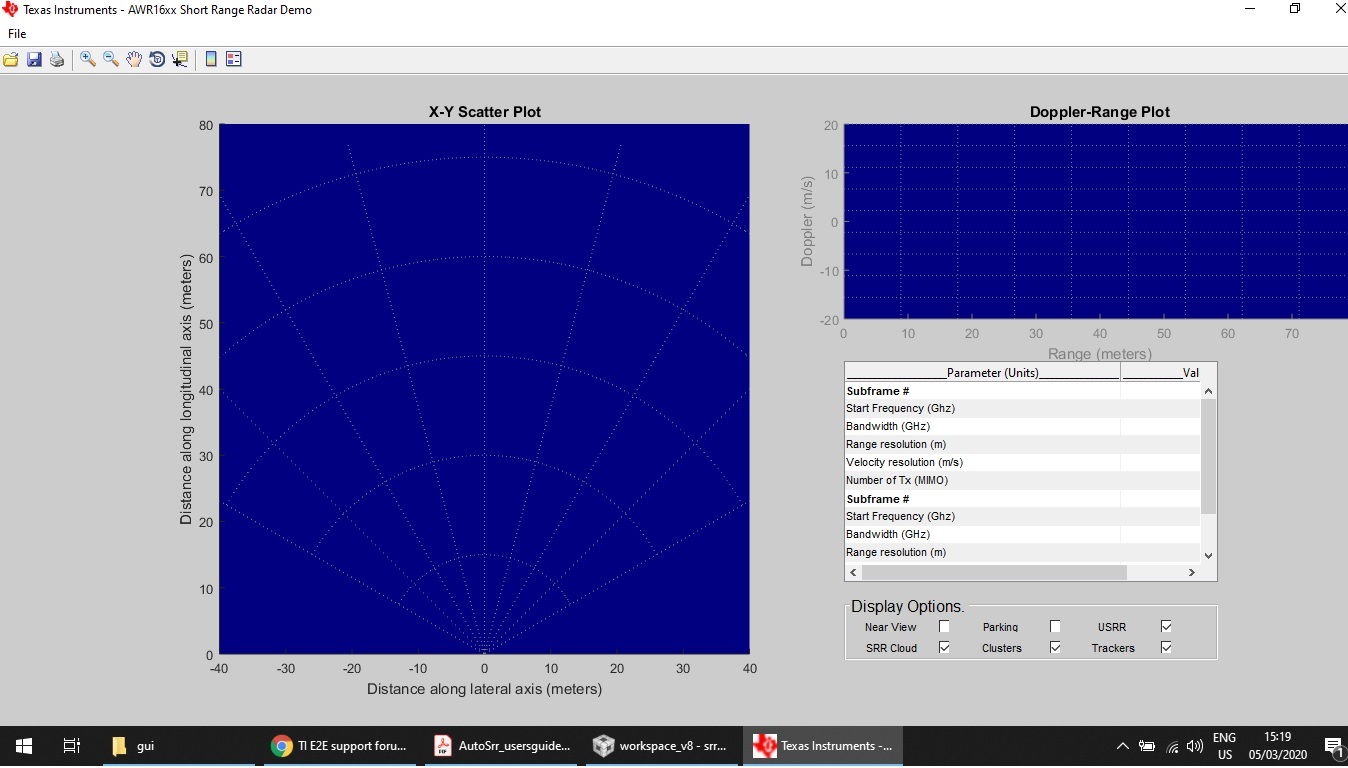
The SRR Visualizer output window appeared and I entered the COM port numbers etc. Then the SRR Demo window appeared but i cant see it is working, there are now targets.

Following is the screen shot.

Following is the screenshot of CCS.

Can you please advise and guide where is the problem and why I cant see any targets as before in SRR demo output window when using in CCS debug mode ?

Best regards

  • Alper,

    I tested the steps that you listed in your post and I was able to get the demo working without issue.

    Please make sure you specify the correct COM ports for the "Application/UART" COM port and the "Auxiliary Data" COM port in the MATLAB GUI launch window.

    Try placing a strong reflector in front of the radar to see if something shows up on the GUI.

    But the demo does work as expected, when both running the pre-compiled binaries and when running the executables generated by CCS.

    Regards,

    Kyle

  • Hi Kyle,

    Thank you for your response.

    1- I had already double-checked that I am entering correct COM ports or not. I entered same correct COM ports for the pre-compiled binaries and then same COM port numbers for for running executables from CCS. However, the SRR demo runs with pre-built binaries but does not run with running executables from CCS.

    2- I had not placed a strong reflector in front of radar for running demo with pre-built binary but you can see in the first figure above that it is a LIVE plot.

    For the executables from CCS, the EVM is exactly in the same place and same environment but nothing shows up at all in the Visualizer graphs, it seems to be a DEAD display, it is not detecting anything at all.

    3-  Am I doing right to only put jumper on SOP0 after finishing UNIFLASH operation in which I flashed the metaimage file   xwr16xx_ccsdebug.bin   located at  C:\ti\mmwave_sdk_02_00_00_04\packages\ti\utils\ccsdebug .

    I realize it sounds strange that you are not getting any problem while repeating same steps but my problem persists. Can you please study my above post again, think more and try to suggest something again ?

    Best regards

  • Alper,

    Yes, after flashing the CCS debug image to your AWR1642BOOST device, you should only have a jumper across SOP0. You can then open CCS, launch a target configuration for AWR1642, load the DSS and MSS executables, and then start the device.

    What you could also try is to ungroup the DSS and MSS cores. Then as individual cores, launch the DSS first and the MSS core.

    I tested this lab again on a different PC and I was able to successfully run the demo on the GUI from the executables generated by CCS.

    Regards,

    Kyle

  • Hi Kyle,

    I acted as per your last advice and the problem was resolved. 

    UnGrouping the cores is the solution. I did this and the demo started to work.

    I grouped the cores again and it was the same problem. Then I UnGrouped the cores again and the demo was working.

    Thank you very much for your advice.

    Although, the issue is resolved, however I wonder why grouping of the cores is causing the this problem ? Can you please comment ?

    Regards