Hi,
I am trying to plot an array using a linegraph tool in GUI Composer.
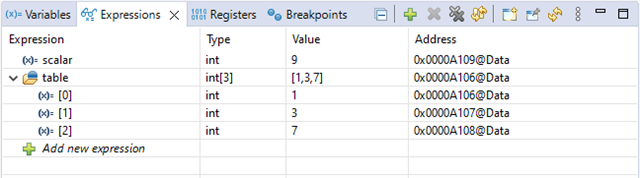
I have defined two variables in C:
volatile int scalar = 9;
volatile int table[3] = {1, 3, 7};
and then I bind the first one in .js:
        gc.databind.registry.bind('widget.linegraph.series_0_values',
        // dependant
        {
            value: 'program.scalar',
        },
        // getter
        function(inputs)
        {
            var string = "";
            for (var i=0; i<3; i++)
            {
                string = string + ',' + inputs.value;
            }
            return string;
        },
        //setter
        {}
    );
everything seems perfect:
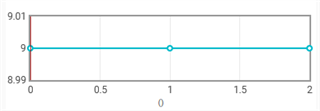
but when I try to do a similar thing with "table":
        gc.databind.registry.bind('widget.linegraph.series_0_values',
        // dependant
        {
            value: 'program.table',
        },
        // getter
        function(inputs)
        {
            var string = "";
            for (var i=0; i<3; i++)
            {
                string = string + ',' + inputs.value[i];
            }
            return string;
        },
        //setter
        {}
    );
I get an empty graph with a red cross on the left (but very shortly thus not visible below):
![]()
Could you please help me with this?