Other Parts Discussed in Thread: SYSBIOS, TMS320C6474
A couple of small questions.
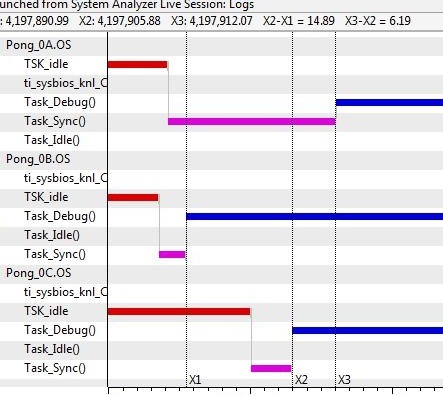
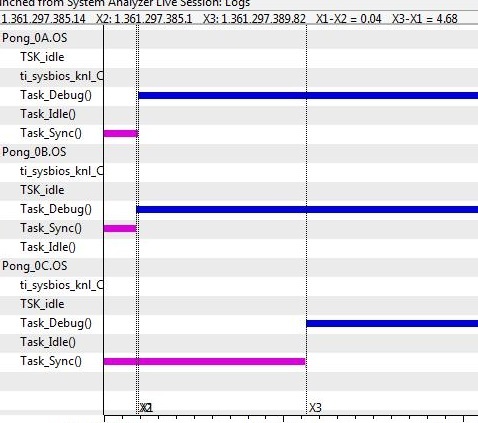
I'm at the point in my project where I need to start utilizing MSA's load analysis functionality. Eventually, I need to capture data for 9 cores (3 C6474 DSPs), but right now I am having problems with just a single DSP (3 cores).
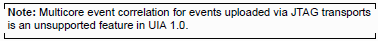
First, if I just run continuously and have everything disabled but the main logger, I keep getting "Out_Of_Seq Data" warnings. (Each core is just printing out a benchmark number every 1 second.) I have the diableMulticoreEventCorrelation is set to false, so other than that, is there some other setting that I need to be setting, or is this just one of those informational only type warnings that I should just ignore?
Second, what's the relationship between the logger's transfer buffer size and the size specified in LoggerSetup object? I have mounds of DDR memory (512 MB total, so I gave each core about 170 MB [exclusive, not shared]), so I am creating and assigning my own loggers like so:
LoggingSetup.mainLogger = CreateLogger( 32*1024, "(UIA) Main Logger", ".logger:UIA_Main" );
LoggingSetup.loadLogger = CreateLogger( 64*1024, "(UIA) Load Logger", ".logger:UIA_Load" );
LoggingSetup.sysbiosLogger = CreateLogger( 64*1024, "(UIA) SysBios Logger", ".logger:UIA_SysBios" );
(CreateLogger is just a helper function I wrote to setup the logger. [see below])
So for the main logger, if the transfer buffer size is set to 32K as shown, what do I need to set LoggingSetup.mainLoggerSize to? (not to mention the Event size, too, which I believe just defaults to 128 MAUs)
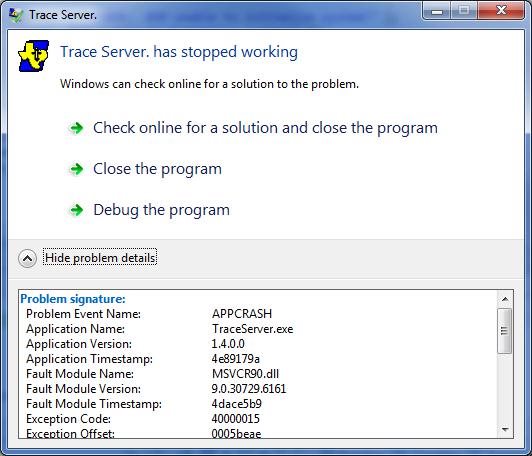
Finally, when enabling anything other than main logging, I have quickly learned that continuous monitoring is just not feasible unfortunately. (Way too much data for CCS to process!) Very saddening. So, okay, I let my program run (each core is just spinning on a single task which is doing a simple filter operation and then sleeps for 1 second and then repeats) and just launched the System Analyzer telling it to only collect data for 2 seconds. It will go through the motions and then start churning through the collected records, but then without fail, I'll get an emulator error about not being able to read the target memory. Says target is not responding to request. (Address cited is always within the load logger's memory section.)
Well, this seems to only happen if I enable EVERYTHING. If I leave hwi and swi logging disabled, I don't get the error. Anyway, my hardware is thoroughly sound (we brutally stress test it, including the JTAG path). In the months I have been working with this particular board, I've never had emulator problems until now. (Maybe MSA is even more brutal of a stress test, eh? :-) ) I lowered the JTAG's TCLK clock down to the legacy 10 MHz, and I changed the TMS/TDO output timing to the standard falling edge, but still I get the error. Any ideas?
I really need to be able to monitor the HWIs and SWIs as those are what are driving the entire system, and I need to be able to measure and visualize the latency between the incoming data and the plethora of tasks I will have processing that data before the next frame comes in, so leaving hwi and swi monitoring disable just so I don't get this emulator error is not a viable option. Could it be my misconfiguration of the log buffers above? Perhaps more is not better, I mean.
Edit: Oh, forgot. For completeness, here is my little CreateLogger() function:
////////////////////////////////////////////////////////////////////////////////
// Function: CreateLogger()
// Description: Helper function used to create a logger.
////////////////////////////////////////////////////////////////////////////////
function CreateLogger( p_nTxfrSize, p_szLoggerName, p_szSectionName )
{
var logger; // logger object
var loggerParams; // logger object properties
var hLogger; // handle to new logger
logger = xdc.useModule( 'ti.uia.runtime.LoggerCircBuf' );
loggerParams = new logger.Params();
loggerParams.transferBufSize = p_nTxfrSize;
loggerParams.bufSection = p_szSectionName;
Program.sectMap[p_szSectionName] = new Program.SectionSpec()
Program.sectMap[p_szSectionName] = OffChip;
hLogger = logger.create( loggerParams );
hLogger.instance.name = p_szLoggerName;
return( hLogger );
}