This thread has been locked.

If you have a related question, please click the "Ask a related question" button in the top right corner. The newly created question will be automatically linked to this question.

project no longer builds

I restarted my CCS because it always locks up after cycling power on my device. now I get an error when I launch CCS and my project no longer builds. I wish I knew how to keep CCS running and avoid distracting delays every time I have to kill the process.

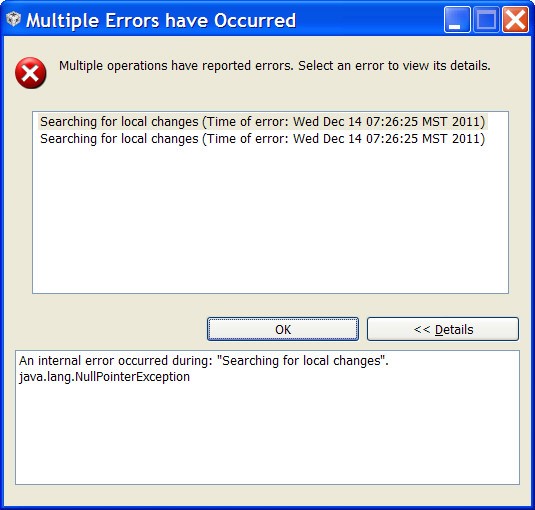
here is the error dialog when I launch CCS.  I get this error all the time on another machine.  on that one I have to remove and readd all of the projects in the workspace.

and here is the output when I try to build

**** Clean-only build of configuration Release for project UnitTest03a_Process ****

C:\ccs4\ccsv4\utils\gmake\gmake -k clean

DEL /F ".\PyrocamIVcfg.cmd" ".\PyrocamIVcfg.s??" ".\PyrocamIVcfg_c.c" ".\PyrocamIVcfg.h" ".\PyrocamIVcfg.h??" ".\PyrocamIV.cdb" "UnitTest03a_Process.out"

Could Not Find E:\PyrocamIV\workspace\UnitTest03a_Process\Release\PyrocamIVcfg.cmd

DEL /F ".\Chopper.obj" ".\Global.obj" ".\Process.obj" ".\PyrocamIVcfg.obj" ".\PyrocamIVcfg_c.obj" ".\SPIFlashLibrary.obj" ".\UnitTest03a_Process.obj" ".\Utils.obj"

Could Not Find E:\PyrocamIV\workspace\UnitTest03a_Process\Release\Chopper.obj

DEL /F ".\PyrocamIVcfg.pp"

Could Not Find E:\PyrocamIV\workspace\UnitTest03a_Process\Release\PyrocamIVcfg.pp

DEL /F ".\Chopper.pp" ".\Global.pp" ".\Process.pp" ".\PyrocamIVcfg_c.pp" ".\SPIFlashLibrary.pp" ".\UnitTest03a_Process.pp" ".\Utils.pp"

Could Not Find E:\PyrocamIV\workspace\UnitTest03a_Process\Release\Chopper.pp

' '

  • Kurt,

    Given that you had failing debug sessions, my best guess would be a corruption in one of the temporary/cache files created by v4 - you can always revisit the Debugger section of the troubleshooting page

    Although a perfectly reproducible testcase is hard to get in such random cases, sometimes when a core is hang by any external reason, CCS can be unfrozen by unplugging the emulator from the USB port. This causes CCS to promptly recognize the communications failure with the emulator itself.

    To further analyze this issue the debug server log would be needed (the methods to obtain it are shown in the page above).

    Regarding the error message, some previous reports (here and here) mention that this pesky error message is thrown by corrupt projects in your workspace, unfortunately we were never able to obtain a concrete reproducible testcase that would help us analyze this further.

    I imagine you probably tried the clean up procedures listed in the section General IDE section of the troubleshooting page above, is that so?

    Regards,

    Rafael

  • basically cleaning the .metadata and the workspace usually recovers from this problem.  my issue is that it seems to be a regular problem on multiple computers.  was hoping there was some kind of solid solution.

    actually, unplugging and replugging the emulator also causes the debugging connection to lock up.  the debugger connects, the GEL file runs, but the program never starts loading.  this situation always requires killing the process. this problem occurs on three separate computers each running different operating systems. that is why I suspect CCS.  but I could be wrong. regardless, I avoid power cycling the device and the emulator while CCS is running.  (the debugger does not need to be running and the emulator does not need to be connected for the lockup to occur. simply cycling the emulator or the device while CCS is running will result in a debugger lockup should I try to load the program)

    since I am typically in the middle of work when this happens, nothing short of an immediate response would be useful.  in that case I would create and post as many logs as requested.  but when a post can go unanswered for a day or two, all I can do is undo and redo until something starts running. maybe it is time to completely clear off CCS and start over again.

    (I am currently trying just that on a 64-bit Windows 7 computer but the install is failing. http://e2e.ti.com/support/development_tools/code_composer_studio/f/81/t/152946.aspx)

  • Kurt,

    I apologize for all the trouble you've been experiencing.

    Your description reminded me of one customer that had a similar scenario described by you. In his case, they had a Windows service developed in-house that monitored USB activity and caused severe instability when connecting to their systems - a side-by-side comparison between their system and an identical brand-new PC evidenced the issue.

    I understand the issue of having unpredictable lockups during work. During a normal work day would you say there are how many lockups? If more than one per day, could you enable the debugserver logs (check this section) during one day of work and send the results to us?

    Severe install issues are easier to detect as they are more deterministic. I will also reply to the other thread.

    Regards,

    Rafael

  • I have some time today and tomorrow to try to resolve this problem. just send me requests for data and answers to questions.

    sometimes the power blips while the debugger is connected to the emulator (like when someone is attaching a probe but slips...). the log was created as follows:

    1) launch debugger, connect to emulator, load program, run

    2) stop program

    3) power cycle device - CCS displays red error messages in console window

    4) terminate debugger and remove emulator

    5) launch debugger, connect to emulator (runs GEL), load program.......no % update....click Cancel....no response....kill process

    I tried to attach the log but I got an error - "404 - File or directory not found.  The resource you are looking for might have been removed, had its name changed, or is temporarily unavailable." I thought maybe this was because CCS was running and had opened the log.  So I copied it to another disk and tried again but get the same error. Tried attaching the file from another computer but get the same error.

  • Kurt,

    Kurt Jensen said:

    sometimes the power blips while the debugger is connected to the emulator (like when someone is attaching a probe but slips...). the log was created as follows:

    Enough to cause a debugger disruption, but let's move on...

    Kurt Jensen said:

    3) power cycle device - CCS displays red error messages in console window

    That's expected. I suppose you are doing this just to reproduce the log, is that so?

    Kurt Jensen said:

    5) launch debugger, connect to emulator (runs GEL), load program.......no % update....click Cancel....no response....kill process

    What happens if you do a step-by-step manual launch of the debugger? Does it still fails in the load program routine?

    What device and emulator are you using? If the device has internal flash, keep in mind that after the power cycle it will start executing the code previously loaded - which means the situation will be different than the first launch (peripherals, PLL and other internal structures will be already configured). 

    Kurt Jensen said:

    I tried to attach the log but I got an error - "404 - File or directory not found.  The resource you are looking for might have been removed, had its name changed, or is temporarily unavailable." I thought maybe this was because CCS was running and had opened the log.  So I copied it to another disk and tried again but get the same error. Tried attaching the file from another computer but get the same error.

    If I understood your remark correctly, the .log file may be locked by a process other than <eclipse.exe>. You can open the Task Manager and look for <javaw.exe> or even <TraceServer.exe>, <TraceCntrl.exe> or <TraceCompMgr.exe>. This should free the .log file.

    Regards,

    Rafael

  • 1) yes, I can imagine losing power on the device causes a debugger disruption.  but one would think that disconnecting and restarting the debugger would recover.  I would not mind but the debugger simply locks up requiring killing the process.  this in turn sometimes corrupts the project and workspace, etc, etc. this can be very distracting and time consuming.

    2) yes, I purposely cycled the power to find a way to reproduce the problem

    3) step by step manual launch - says and shows program loaded 100% but locks up with wait cursor with load dialog displayed

    4) device is c6748, emulator is XDS100v2. yeah the device may be running but isn't the emulator supposed to take over?

    5) I copied the file to another computer.  The file is not in use on this computer.  CCS is not even installed on this other computer.  And I get the same 404 error. I just tried again with another copy from another disk - same error... :(


  • but wait, there's more...

    3) I left and came back - the dialog was gone and the program was running.  another case where it did not stop at main() during loading.  so I stopped the program, Target | Reload program... dialog came up, appeared to reload normally,  but now CCS is completely locked up with the wait cursor.

    please note that if I then restart CCS without changing anything on the emulator or the device, it all works fine

  • Kurt,

    1) You are right. CCS should (and usually does) recover from a power loss on the target.

    3) That and your next thread make me believe the connection is extremely slow. I guess not, but asking won't hurt: are you running this from a Virtual Machine (VmWare or Virtualbox)?

    4) Contrary to common sense, the emulator does not have complete control of the device in all situations - if the core has a misconfigured clock, is powered down, held in reset, locked up, etc., the emulator is not able to regain control of it. That's why sometimes the emulator fails to reconnect after running potentially disastrous code.

    5) Very strange error; no idea what is happening in this case; error 404 usually comes from the web browser. What browser are you using? Can you try to zip the file and attach it to the post using the file (not the URL) option? (I know you attached a log in the other thread, but after a long day of work I felt compelled to post the screenshot anyways...).

    Regards,

    Rafael


  • 3) no, no virtual machines

    4) our program is not doing anything extreme.  it currently does boot to a working program although I do not see it working when the lockup occurs. we do not change the clock, do not power anything down, we do bring many modules out of reset. the current board has a design flaw that posts a boot code of 0x00 instead of the necessary 0x0c (SPI1 flash). the only way to boot to our code is with a hardware reset. don't recall what boot code 0x00 does.

    5) maybe that is the clue.  I -am- using the file option.  using Firefox in all cases because IE9 locks up trying to post to this forum. error 404 is being displayed in a dialog by your upload code.

  • 4) a possible workaround for this lockup issue is to disconnect from the core (do not terminate the debug session), perform a hardware reset and then reconnect. This way you will gain time for the debugger launch and can potentially overcome the locking issue.

    5) IE9 works if you select the compatibility mode. Check: http://e2e.ti.com/support/development_tools/code_composer_studio/f/81/t/147219.aspx#532292


  • Kurt,

    In conversations with some colleagues they mentioned an intermittent bug in CCSv4.2.4 (SDSCM00041821, status in the link SDOWP below) that manifests itself as severe delays during the connection process.

    The workaround to this bug is to rename a component called <cTools.dll> that is located in <ccs_install_dir>\ccsv4\emulation\analysis\bin to something else and restart CCS.

    This particular issue was fixed for CCSv5.1, but it surely would be worth trying this workaround in your case.

    Hope this helps,

    Rafael